
Does your business have complex processes that team members often mix up?
Does a team member ever forget that their step in a process is dependent on another task, causing issues?
Maybe new team members are lost and don’t know how their steps fit into the entire process.
If so, have you considered business process modeling?
In this article, we will look at:
- What is process modeling?
- Benefits of business process modeling
- Business process modeling techniques
- What are the steps in process modeling?
What is process modeling?
Process modeling is creating illustrations of an organization’s business processes. Examples of business processes include a PTO request or invoice generation.
These processes all have a series of steps from start to finish.
For example, consider a website that takes orders for flower delivery. A customer would select the flowers they would like off a website and add them to their cart. An order confirmation page would be generated once they click “check out”. They would enter their payment information and shipping address. When they click the “place order” button, the system would check that the credit card transaction went through correctly.
If there were any issues (expiration date was invalid, security code was invalid, or they didn’t have enough money on their credit limit), the system would decline the transaction. The customer would be prompted for a new payment method. When the credit card is successfully validated, then the order would be entered into the system for fulfillment. These steps are what you would illustrate in a process flow diagram.
Process modeling assists with analyzing and looking for ways to improve processes. When you document a process, it’s much easier to sit down with your team and visually review the steps than to talk about them with no visual reference.
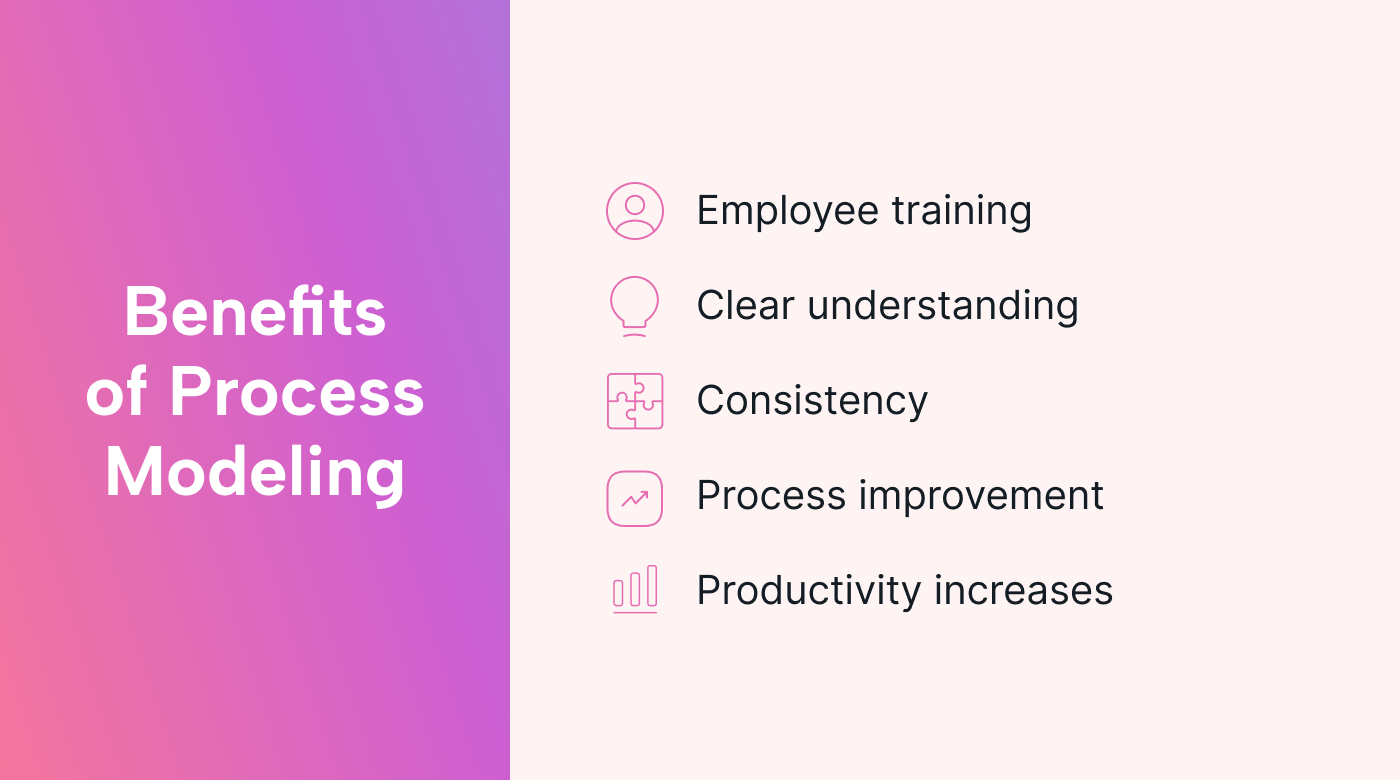 |
Benefits of business process modeling
Various methods of business process models can provide a visual that contains the steps that occur and who performs them, and lots more.
Let’s take a look at some of the ways process modeling can benefit your business.
Employee training
New employees can use the process documentation to learn about the processes they will be working on. They can see where their steps are in relation to other steps and what they depend on.
Clear understanding
When a process is documented, it is less likely to be misunderstood. Team members aren’t relying on memory – they can look at exactly how the process runs.
The process model can also be shared with other teams with questions about your process. If stakeholders want to see what is involved in creating a product, they can view the process model to learn about the steps.
Consistency
Having a process documented makes it easily repeatable. There are fewer chances for missteps or mistakes.
Process improvement
The process can be studied for redundant tasks or areas that can be made more efficient. Because you can see and measure what happens during a process, what the dependencies are, and who is involved.
You can measure the time each step takes, or how long the entire process takes, and identify opportunities to improve or optimize the flow and accelerate the outcome.
Opportunities for automation can be identified. Automation both eliminates human error and speeds up the process. When team members no longer have to perform tedious tasks that are automated, their schedule frees up to work on other tasks.
Increased productivity
When the team has a clear understanding of the process and it has been optimized through process improvement, the team operates more efficiently, and productivity increases. No one has to figure out what’s next.
Business process modeling techniques
Many process modeling techniques use common symbols. Some of the most frequently used symbols are:
- Rectangles to represent activities that happen within a workflow,
- Swim lanes to represent ownership of each step,
- Arrows to represent the direction of flow from step to step,
- Diamonds to represent decision points,
- Ovals to represent start and end points.
Let’s learn about a few types of business process models.
Flowchart
A flowchart is used to illustrate process steps in sequential order.
It shows the flow from an input, through processes, to an output.
Flowcharts are a popular and well-understood type of process flow diagram. They are useful to document processes for an audience that might not be familiar with the meaning of a lot of symbols used in other notations, such as BPMN. For example, a company wide diagram for a PTO process could benefit from a flowchart - employees throughout the company in different types of roles would be able to follow the flowchart.
BPMN diagram
BPMN stands for “business process modeling notation.” Standardized symbols are used to document processes.
While it requires time to learn, BPMN enables users familiar with the standardized symbols to look at a diagram and know exactly what is supposed to happen.
Since BPMN has symbols representing business processes (such as events and exceptions), it is useful in business process management or improvement initiatives. Business analysts can use it to document systems as they are, processes being improved, or systems that are being designed.
Universal process notation
UPN is a simple way to map a business process. UPN uses activity blocks to show who is doing a task, what happens, and when it happens. The average user very quickly understands it.
An example activity block might be an account executive making a sale. The account executive is the “who.” The “what happens” would be “sell to the customer.” The “what” happens always starts with an action verb. Arrows show the flow from one activity box to the next activity box.
UPN is useful when you want to have the option to drill down from a high level view of a process into the sub-processes below it.
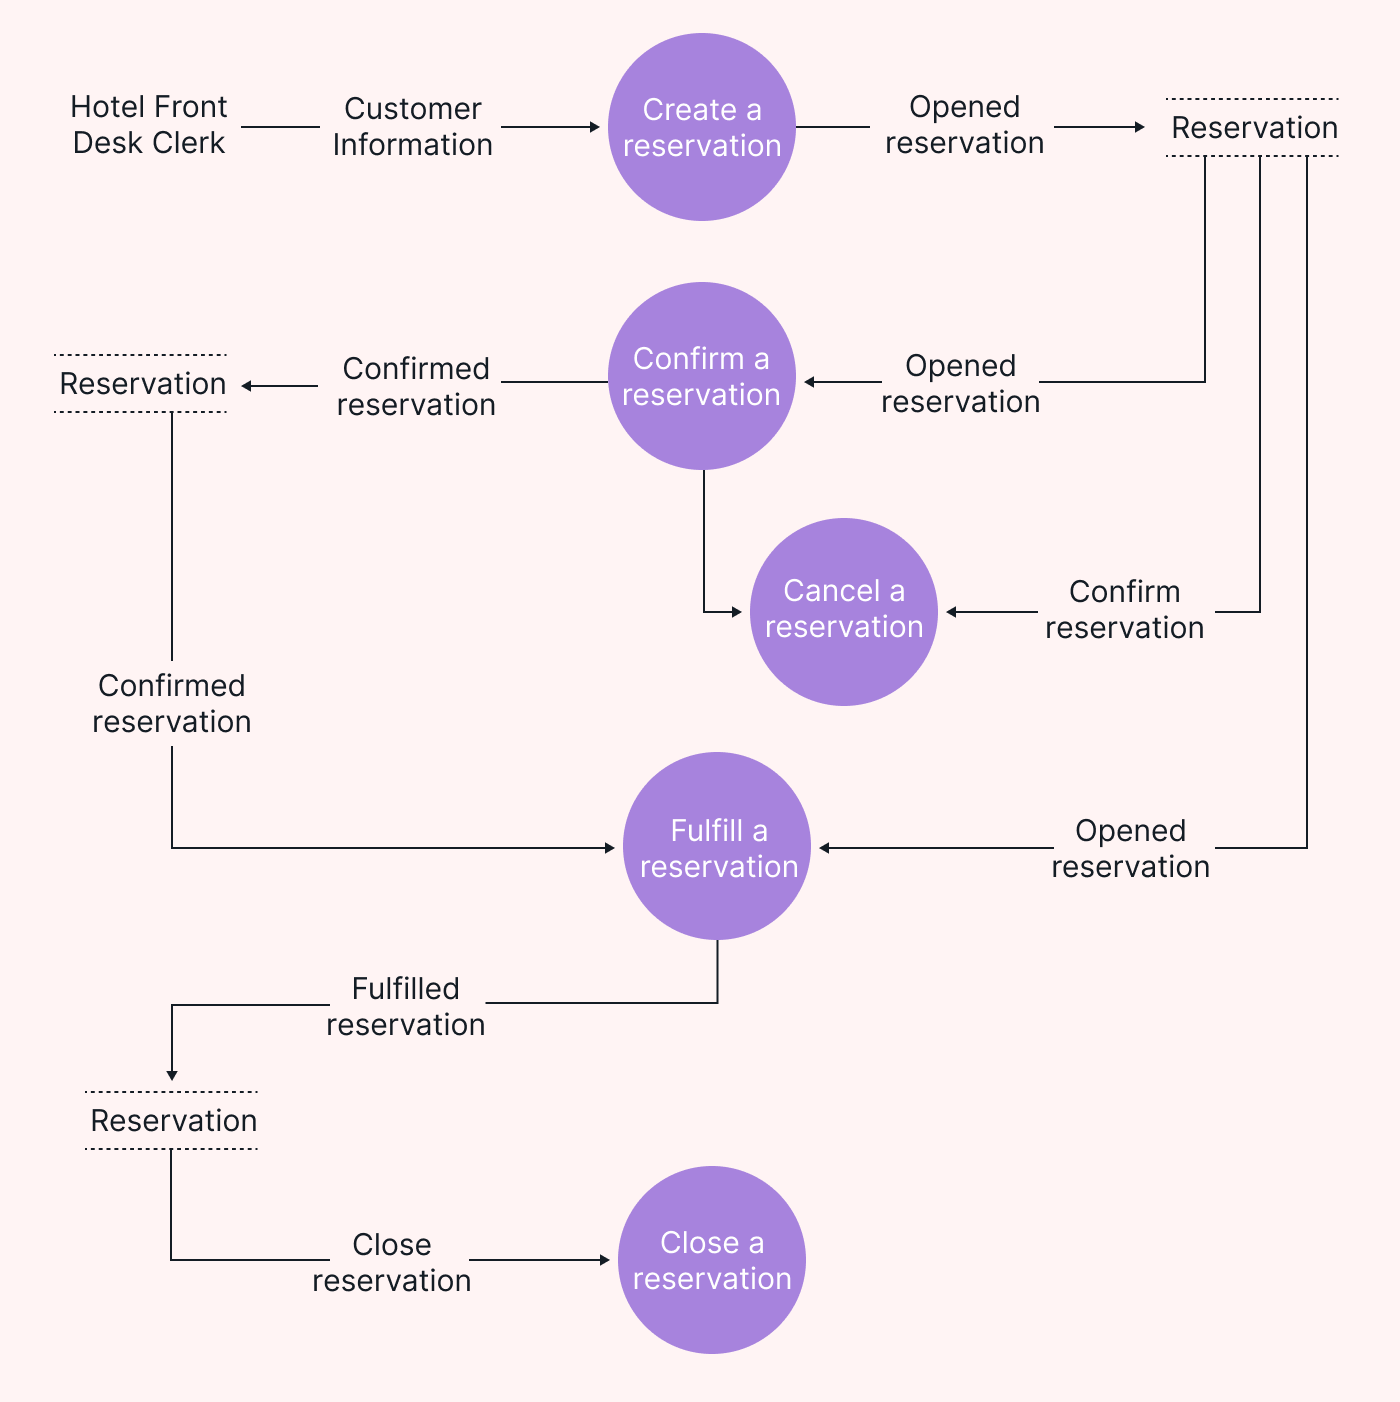
Data flow diagrams
A data flow diagram maps how information travels through a process or system. It’s useful in the software development life cycle to make sure the IT team and the end users.
For example, when you make a reservation at a hotel, this information travels through a system. The system performs checks such as ensuring that your dates and requested room types are available. We all like to know if a reservation was received, so you’ll receive a confirmation via e-mail or text, which is generated from the information you gave during your request.
 |
UML diagrams
UML stands for "unified modeling language." UML represents the architecture, design, and implementation of complex software systems. Recently it has become popular for modeling other kinds of systems, as well.
Structural UML diagrams show how a system is structured. It includes components of the system and relationships between elements, such as classes and objects.
Behavioral UML diagrams show how a system behaves and interacts with users and other systems.
Value stream diagrams
A value stream diagram shows the flow of materials and information to get a product to your customer.
They show you which activities add value and which are simply wasted time. For example, if your business takes a week to ship finished products, this week is wasted time. Nothing is accomplished from products that are not being used (or paid for). Your organization could consider ways to speed up the shipping process based on the value stream analysis.
Value stream diagrams are useful when a problem has arisen, such as a bottleneck in an order delivery process, or expensive inventory in a manufacturing process.
Let’s take a look at two project scheduling techniques. While not technically process models, the images they create can be considered process models for a project.
Gantt Chart
A Gantt chart is a visual representation of a project’s tasks, milestones, and dependencies in a horizontal bar chart, showing when in time each task will be performed.
Use a Gantt chart when you are working on creating a project schedule during your project planning, or when you want to see dependencies among tasks.
An example use case is a construction project. In a construction project, tasks need to be completed in a certain order. Work such as electrical or plumbing that needs to be done inside a wall has to be done before the wall is finished and painted.
PERT chart
PERT stands for “program evaluation and review technique.”
A PERT chart outlines all tasks and activities to help you determine how long a project will take.
Three estimates are made: the shortest amount of time per task, the most likely amount of time, and the longest amount of time it could take if there are unforeseen issues. The PERT chart also shows the relationships between tasks.
PERT charts are useful to help determine target deadlines.
What are the steps in process modeling?
Determine the process you want to document
For illustrative purposes, let’s document a simple PTO request process. This simple process could be a part of a larger human resources process.
List the steps involved
For complex processes, you will want to get input from team members involved in the process who are experts on their parts of the process.
For our simple PTO example, a PTO process flow would have the following steps:
- An employee enters a request for time off
- A manager reviews the request
- Either an approval or denial decision is made about the request
- A notification of the approval or denial is sent
Choose the technique to use to document the flow
For our PTO request, since it’s a simple flow, we might just go with a flowchart.
BPMN would be a good choice for a business process such as a credit card transaction – but it would require your audience to know the symbols you would use. UPN might benefit an audience that isn’t familiar with BPMN.
An order processing system that needs to show how information such as orders and shipping information flows would benefit from a data flow diagram.
Software systems would benefit from a UML diagram.
If your process is having issues such as cost concerns, long lead times, or efficiency issues, a value stream map would be ideal to help identify activities that are causing lost productivity.
Create your process flow
Document the steps in your chosen technique.
Below is an example documented PTO flow chart.
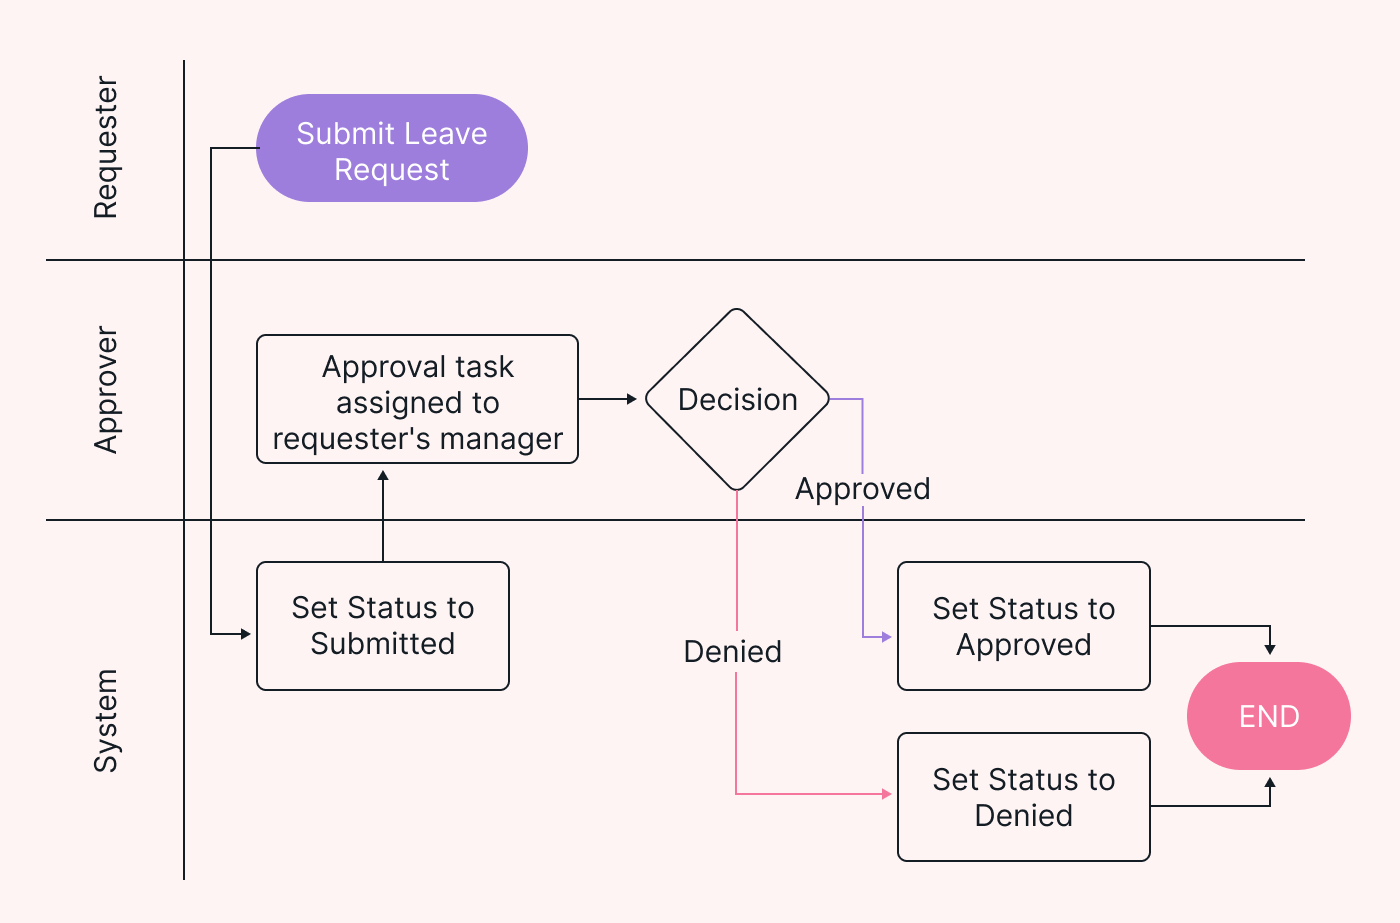 |
Test the flow and modify it as needed
As you test the flow, be on the lookout for ways to improve it.
Over time, new steps may be needed, or other steps may become unnecessary. For example, in this process, it would make sense to add a step to notify the Requester of the result.
For example, if an opportunity for automation is identified, manual steps might be eliminated from the process flowchart. The chart should be updated to reflect the current state of the flow.
Use Motion in your process improvement projects
If you are working on a process improvement project, consider using Motion to keep the steps moving.
Add tasks from your project to Motion’s Task Manager. Motion will add them to the optimal spot in your team members’ calendars to ensure they are completed on time. Motion will place the task among each team member’s other priorities and alert you if any scheduling conflicts will cause a task to miss a deadline.
If you are not already using Motion, access a free trial today.


