
In the fast-paced world of project management, effective planning and scheduling are critical to success. But projects often face unexpected challenges that make it hard to stick to your project plan and keep things on track — particularly for complex projects.
Fortunately, there’s a way to bring clarity and confidence to your project scheduling: creating a PERT chart.
In this article, we’ll explain what a PERT chart is, how it helps in project management, and how to create a PERT chart of your own.
What is PERT in project management?
PERT, a project management tool, stands for program evaluation and review technique. It outlines all the tasks and activities involved in completing a project to help you identify the following:
- The shortest amount of time it takes to complete each task
- The most probable amount of time to complete each task
- The longest amount of time tasks could take if things don’t go to plan
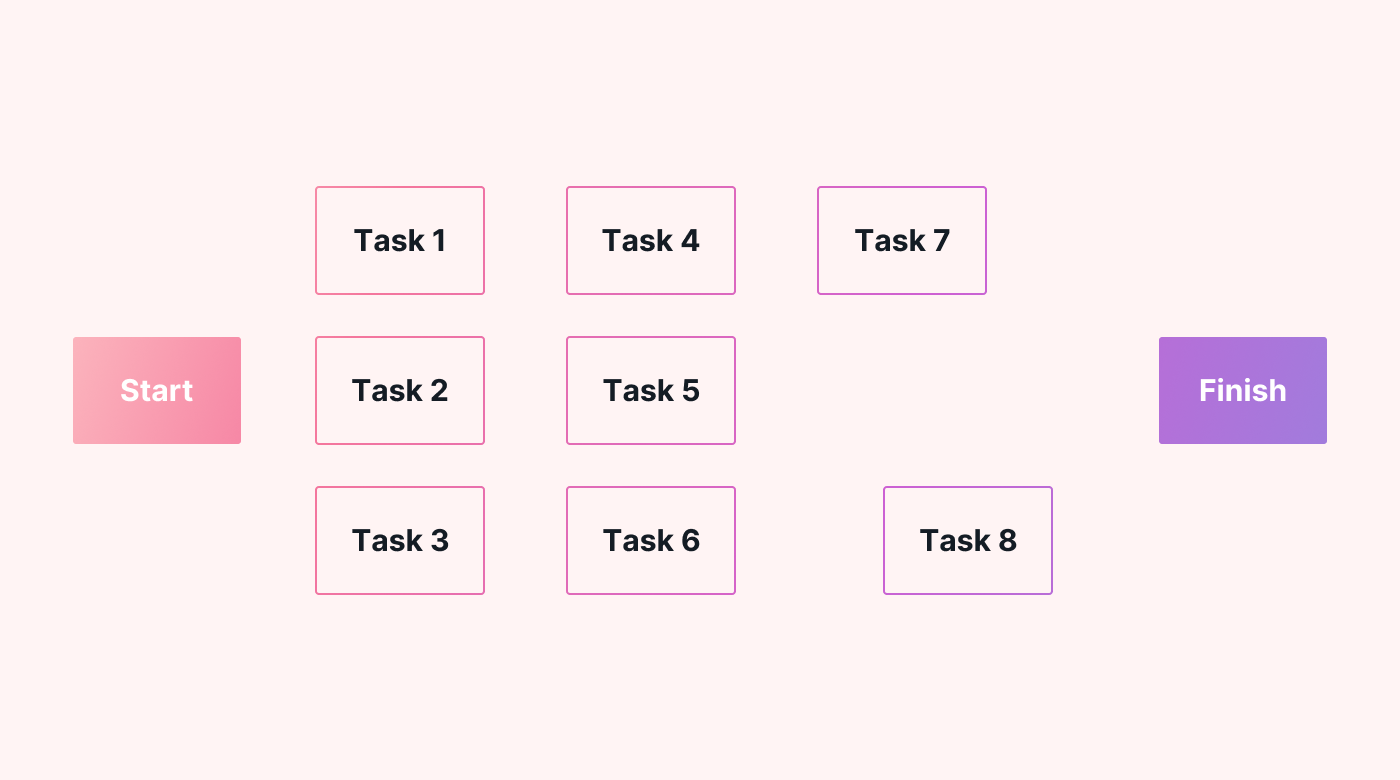
The diagram's structure is similar to a flowchart or network diagram. The start sits on the left-hand side, with arrows moving through the tasks until you reach the finish. It helps you visualize all the tasks (and their durations) in a single glance.
 |
The diagram also involves using three time estimates to calculate the duration of each task. These are optimistic (O), pessimistic (P), and most likely (M) — we’ll look at these in more detail later.
By averaging the three timeline estimates, the PERT approach encourages you to consider uncertainties in your project when calculating timeframes. As a result, you can predict a more realistic forecast for the duration of your project.
Where did PERT come from?
The US Navy initially developed PERT in the 1950s. They used the chart to manage and coordinate complex and time-sensitive Polaris submarine missile program activities.
Today, it’s used by businesses across various industries to manage complex projects. It helps project managers and business leaders across the globe to manage projects that involve a significant level of uncertainty.
Why?
Because it’s an excellent framework for identifying uncertain schedule situations. It forces project managers to consider what could go wrong and how hurdles can impact task duration.
Due to its probabilistic nature, PERT helps project managers prioritize tasks, risks, and even plan for the worst-case scenario.
How to create a PERT chart for your project
Let’s walk through the steps you can follow to create a PERT chart of your own.
Identify project tasks
Start by identifying all the tasks and activities required to complete the project. All of your project tasks will be added to the PERT chart, so it’s important that you identify all of them. If you don’t, you risk missing vital information from your chart.
To successfully outline your project tasks, you need a clear picture of what your project involves. This is where the project scope can help.
The project scope outlines your objectives, deliverables, and boundaries for your project work. With a clear understanding of what’s within scope, you’ll be in a much better position to identify all the tasks that’ll help you reach your project goal.
Once you know the scope, you can break it down into the pieces you need to deliver. This is known as developing a work breakdown structure (WBS). Creating each piece of the WBS requires one or more tasks. So that’s how you can identify all the tasks that need to be completed to deliver the project scope.
To ensure you’ve covered all the tasks you need for your project, it also helps to visualize all of them in a single location.
With a tool like Motion, you can add all your project tasks in the project view. Then, you can easily see every task in one location. As a result, you can easily spot any missing tasks or gaps in your project task list.
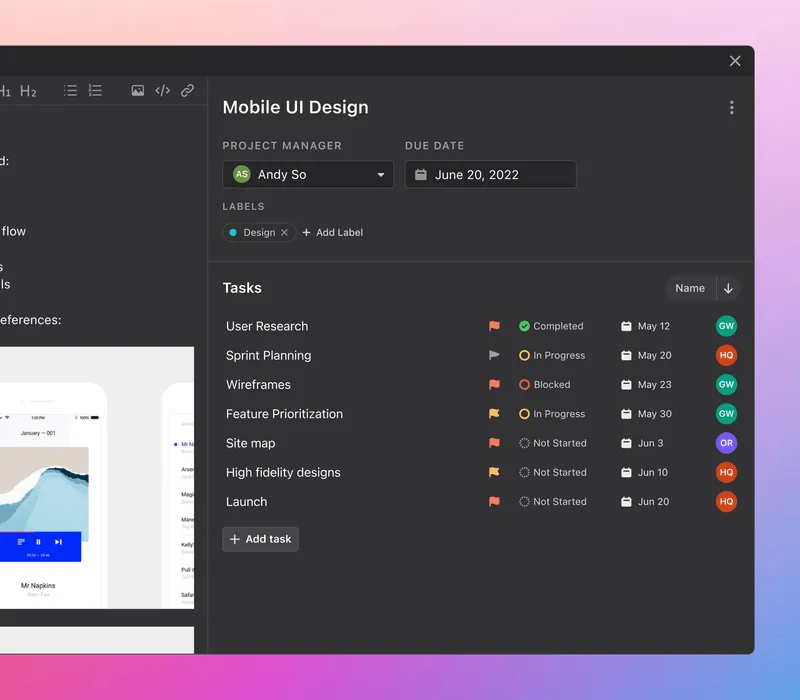 |
Find out more about using Motion for task management.
Determine task dependencies
Dependencies are the relationships between tasks, where one task relies on the start or finish of another task.
By pinpointing dependencies, you ensure all your tasks are ordered correctly in your PERT chart. Plus, you’ll be able to spot the top priority tasks and identify the critical path (more on this later).
Here are the different types of dependencies to look out for:
- Finish-to-start. One task must finish before another can start. For example, in a construction project, the drywall installation must be completed before the walls can be painted.
- Start-to-start. Two tasks must start together. For instance, in software development, the coding of different modules can happen at the same time to speed things along.
- Finish-to-finish. Two tasks must finish together. In an event planning project, for example, the teardown and cleanup of the event can only take place when all guests have left.
- Start-to-finish. One task must start before another can finish. An example could be shift changes in a hospital. The doctor finishing work at 5pm can’t leave before the next doctor arrives to take over.
Estimate task durations
The next step is to gather time estimates for each task. This means figuring out how long you expect each task to last from start to finish.
You can tackle a few different approaches to estimate task duration. You can review previous projects to see how long the tasks took to complete, talk to team members who have worked on similar tasks or break the tasks down into smaller subtasks to get a better understanding of what’s involved.
With the PERT approach, you’ll also need to focus on getting three estimates for each task:
- Optimistic (O). This is the best-case scenario, representing the shortest possible duration of the task if everything goes as planned.
- Most likely (M). Considering normal conditions and resources, this is the most realistic and likely estimate for the task’s duration.
- Pessimistic (P). This is the worst-case scenario. Considering all potential setbacks, issues, or delays, it represents the longest possible duration for completing the task.
These estimates represent each task's best-case, most probable, and worst-case durations. Using these three estimates, you can calculate the expected duration and variance for each task — which leads us nicely to our next section.
Use the PERT formulas
Using the estimates you gathered in the previous step, you can now use the PERT formulas to calculate each task's expected duration and variance.
The expected duration (TE) represents the best estimate of the task's actual completion time. It considers the optimistic, most likely, and pessimistic time estimates, assigning more weight to the most likely estimate. The variance (σ^2) measures the uncertainty or variability in the task's duration.
Here’s how these formulas look:
Expected Duration (TE)
TE = (O + 4M + P) / 6
Variance (σ^2)
Variance (σ^2) = [(P - O) / 6]^2
Using these formulas, you can ensure that your time estimates are as thorough and accurate as possible for your PERT chart. It also helps you optimize your project schedules, assess risks, and identify the critical path.
Construct the PERT diagram
Now that all your task durations are laid out, it’s time to construct your PERT chart.
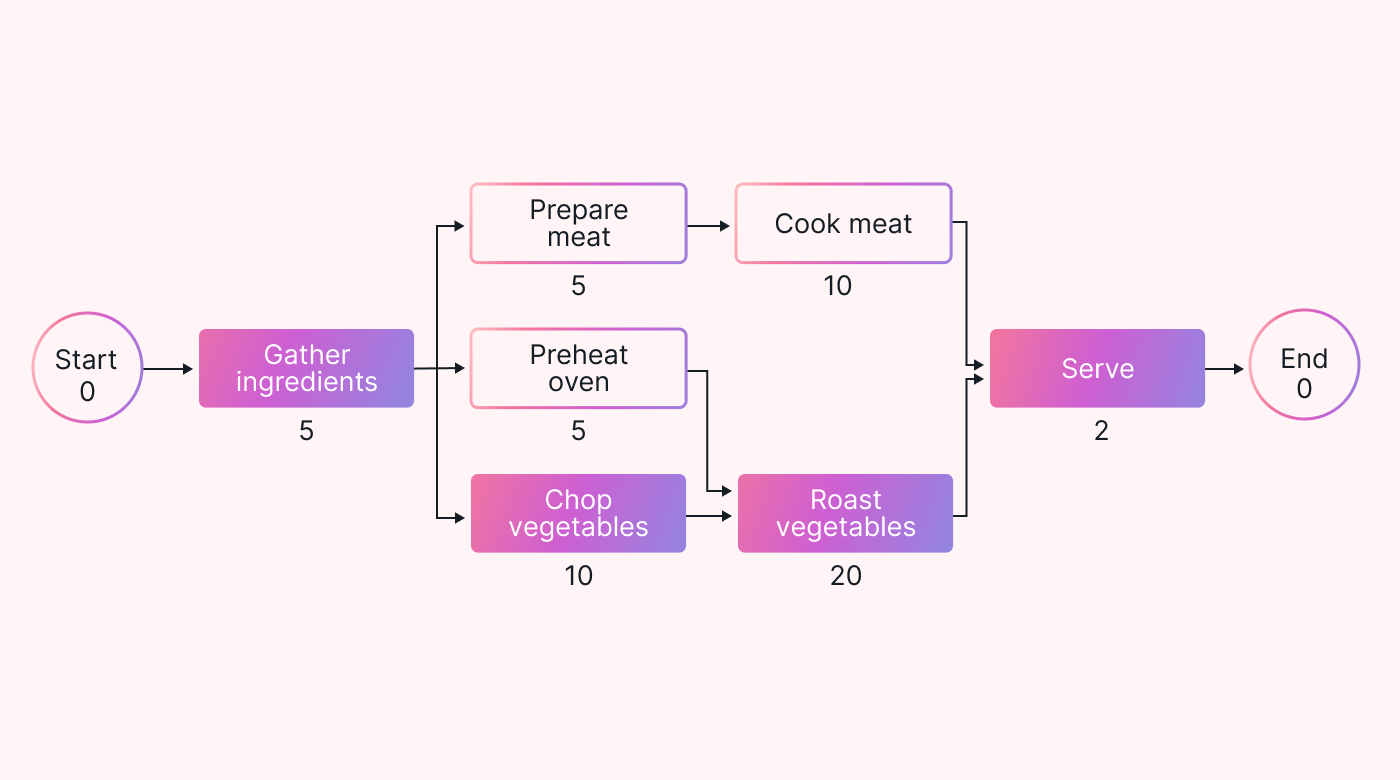
To do this, you’ll create a visual representation of the project tasks, dependencies, and expected durations using a network diagram (which is similar to a flow diagram).
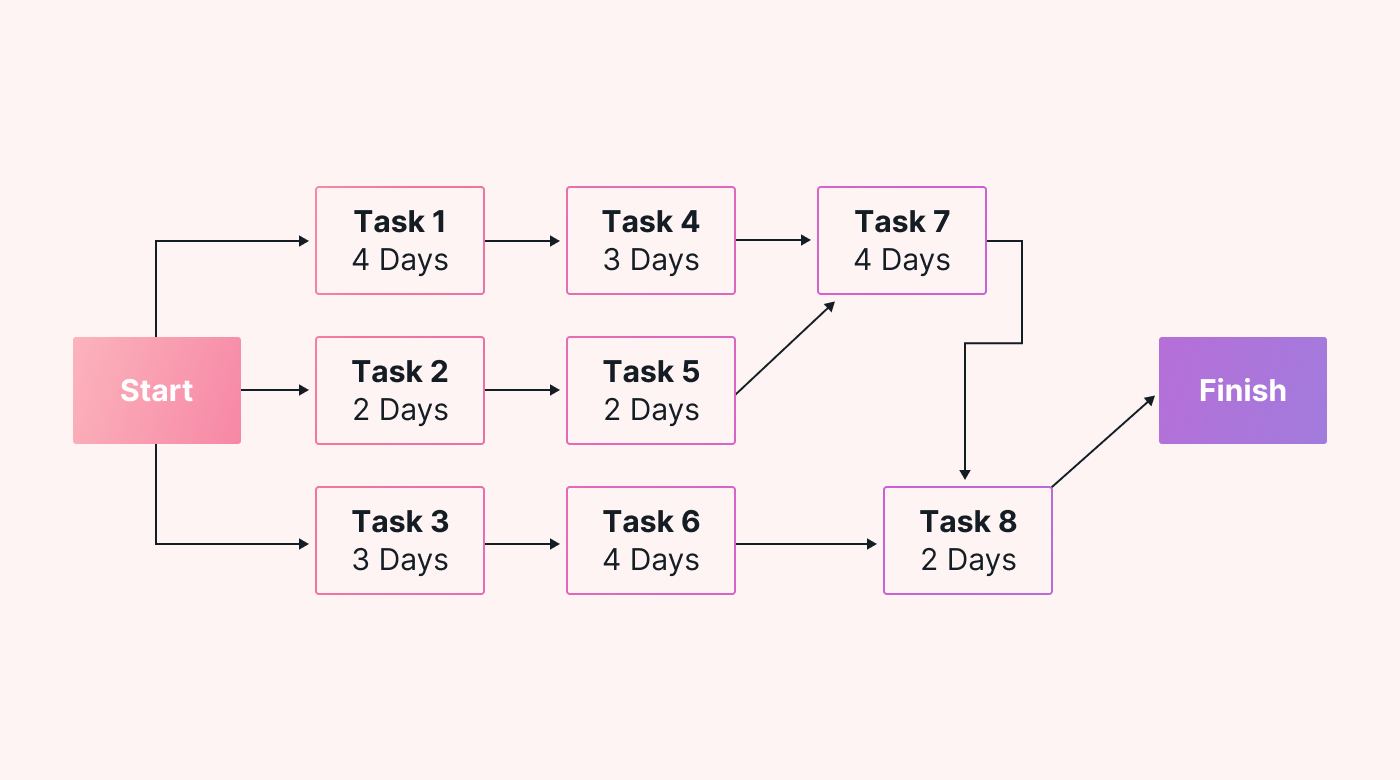
The diagram begins with a start node and finishes with the end node. Tasks are added between these two nodes, with arrows indicating the flow and sequence between them. Each task should be labeled with its expected duration.
 |
Unlike some project management charts, the PERT network has no task left hanging in the diagram. Instead, all tasks have the following:
- Arrow(s) coming into them from the start node or from each task they depend on
- Arrow(s) going out of them to the next dependent task(s) or to the end node.
Identify the critical path
After creating your PERT chart, you can now identify the critical path.
The critical path is the longest path of dependent tasks and determines the minimum project duration. It includes tasks with zero slack or float, meaning any delay in these tasks will directly impact the overall project duration.
In other words, if any of the tasks in the critical path are delayed, the entire project end date will also be delayed.
Here’s how you might highlight the critical path in your PERT chart:
To find the critical path in your PERT chart, you can add up the expected durations of all tasks along each path in the chart. The path with the longest total expected duration is the critical path.
Find out more about mastering the critical path method in your project timeline.
Set milestones and deadlines
You can now establish project milestones and deadlines based on the critical path and expected durations.
Milestones are significant points of achievement in your project, while deadlines are the completion dates for tasks or project phases. For example, a milestone could be releasing a new product feature, while the project deadline will simply be the project's end date.
Here are a couple of tips for setting realistic and achievable milestones and deadlines in your PERT chart:
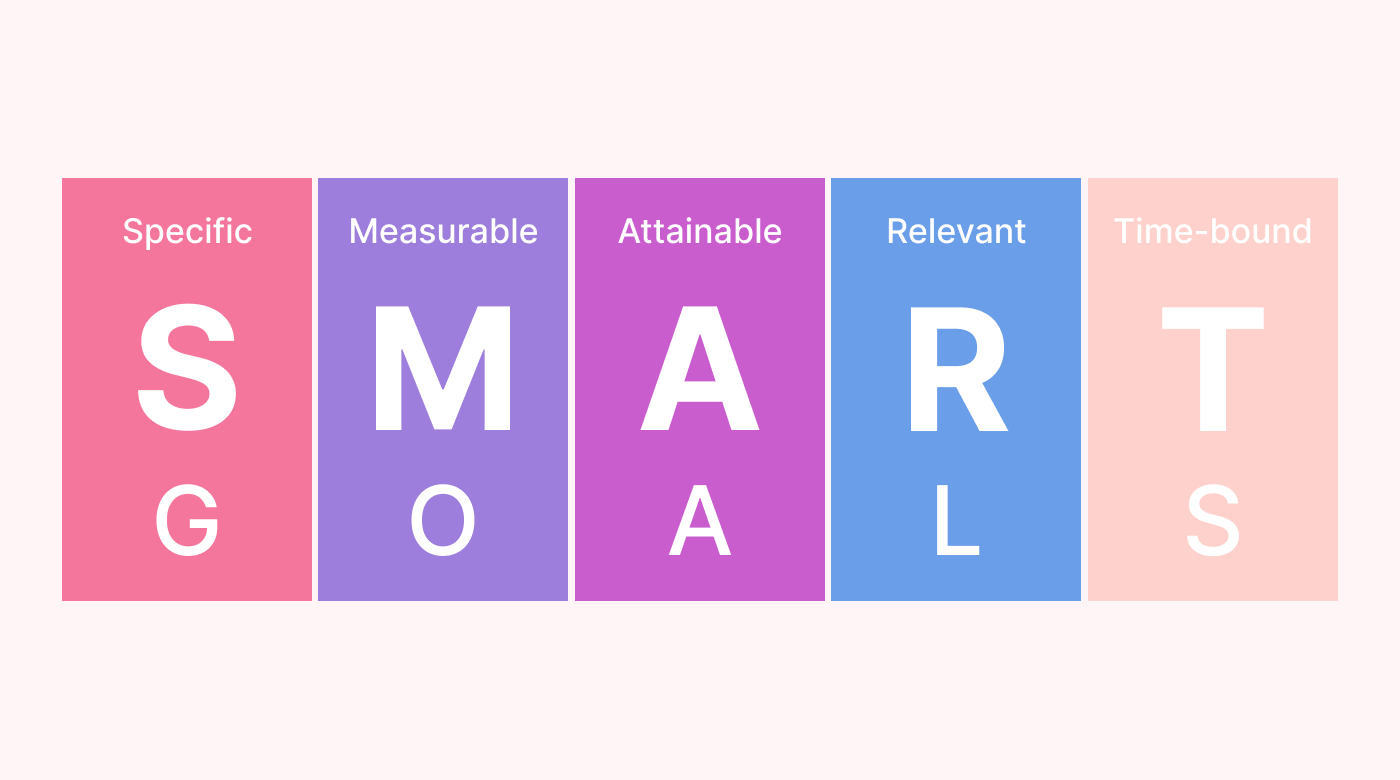
- Be realistic. When it comes to deadlines, you need to be realistic with your due dates. If you’re not, you’re setting your project team up for failure before you’ve started. To make sure your deadlines are achievable, consider using the SMART goals framework to set your project goals. This framework helps you set clear and concise goals with realistic timelines. Find out more about how to use the SMART goals framework.
- Flag important tasks. To help you pinpoint milestones, it helps to note any important tasks in your project timeline. Then, you can use these tasks to identify which parts of the project could serve as milestones. For example, let’s say you have a number of tasks that relate to the launch of a new software feature. All of these tasks contribute to a significant event in the project (launching the feature), so you can use this as a milestone.
Monitor and manage the project
At this stage, your PERT chart is complete. Congratulations!
But the work isn’t over just yet.
A PERT chart is a live document that should be updated in real-time.
In other words, you must regularly review and update the PERT chart throughout the project lifecycle. This means tracking the progress of tasks, identifying any changes or delays, and adjusting the project schedule as needed.
This is where using a digital tool comes in handy.
With a digital platform, you can easily track project progress in real-time. Plus, it’s easy to make changes — instead of scribbling out your hand-written tasks, you can simply click and move things around.
Take a look at Motion as an example. Our simple drag-and-drop feature can move project tasks, update your schedule, and access project information in real time.
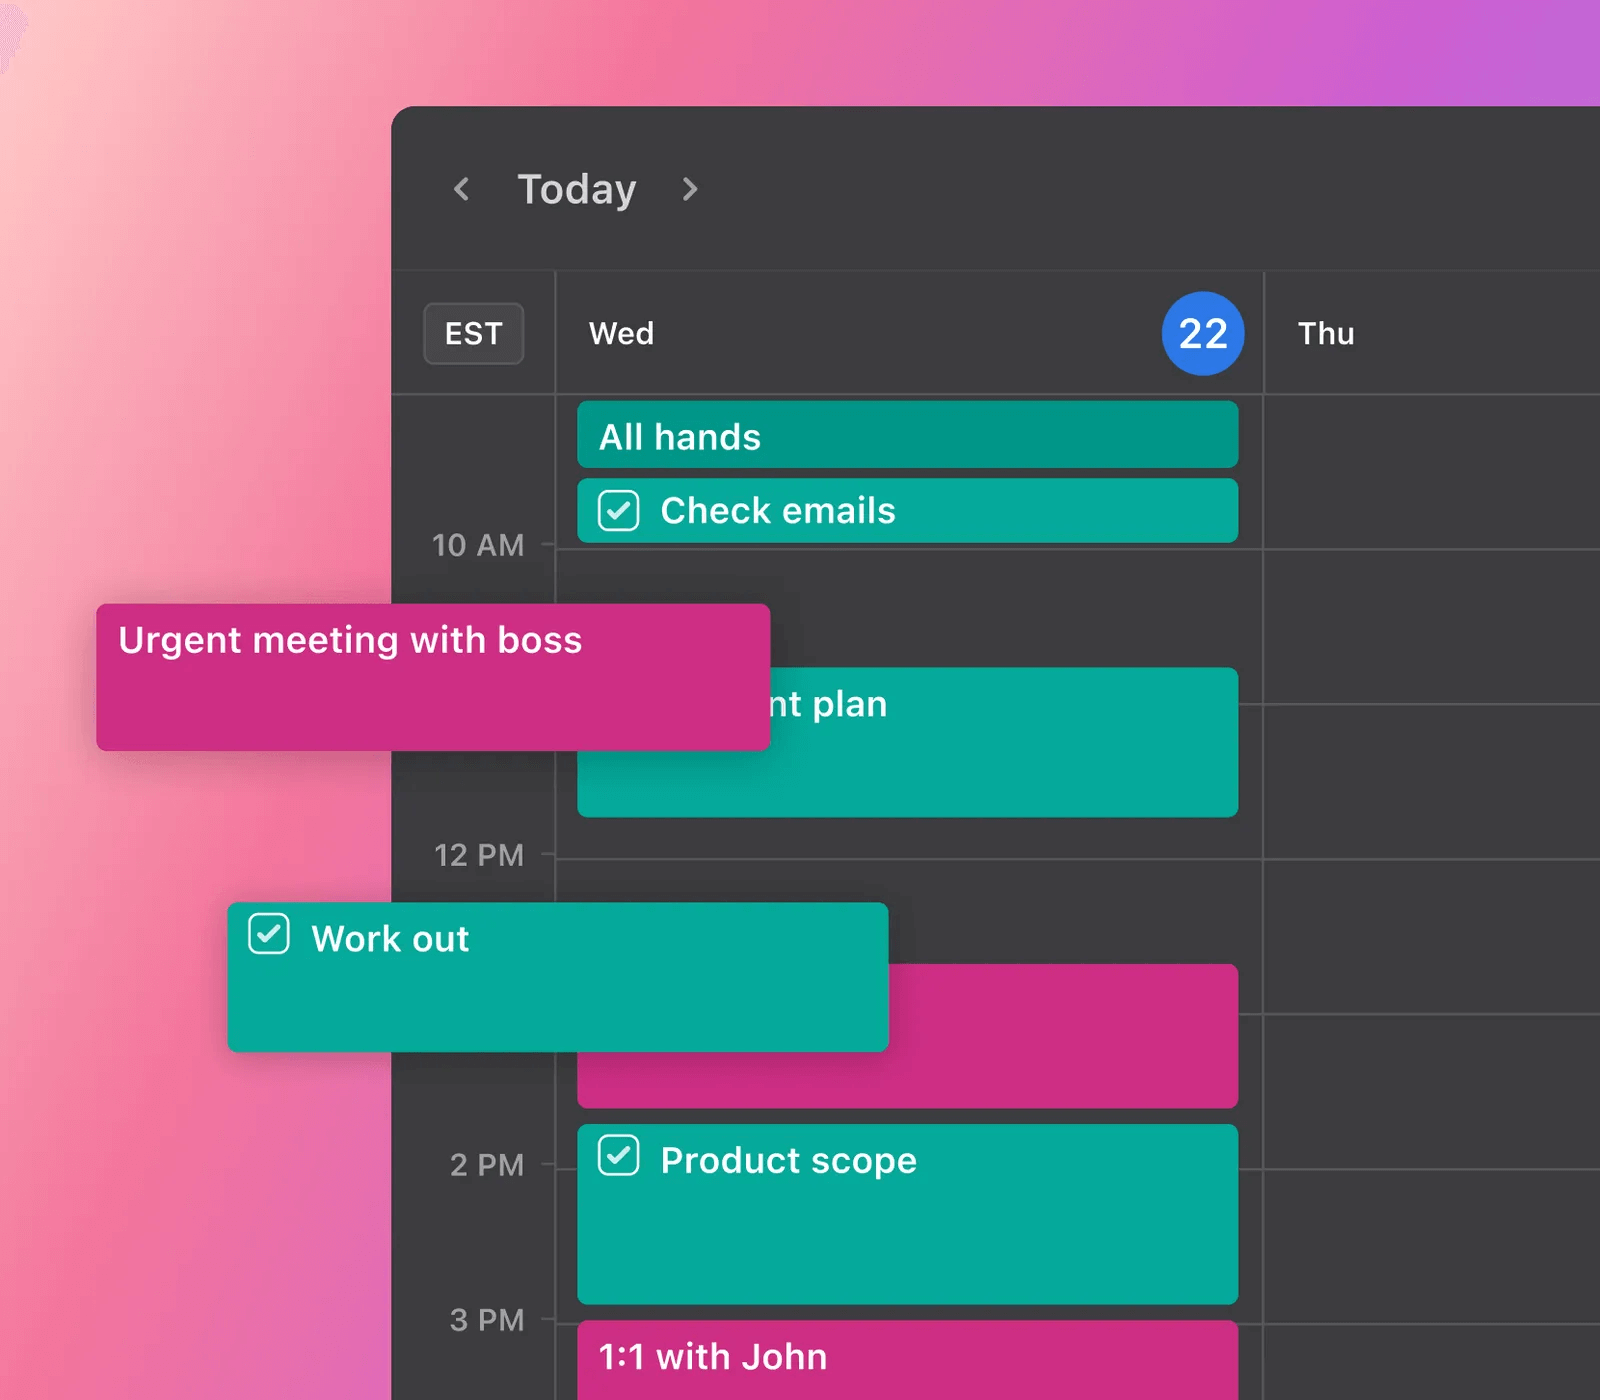 |
As a result, it’s easy for you to keep your PERT chart up to date and make sure the project is progressing as planned.
Use Motion to manage your project
PERT is an incredibly useful tool for project managers and business leaders. When done well, it helps you visualize your project tasks, estimate project duration, and pinpoint the critical path.
As a result, you can prioritize the most important tasks and get a clear picture of how long your project will take to complete.
To make sure you and your project team have the transparency you need to visualize all your project tasks, consider using Motion.
Our work management platform lets you plot all your tasks in a central location. And our Intelligent Calendar automatically updates your schedule (and your team’s) with the most important tasks and activities without having to manually move them. Sign up for a free trial to see how it works!


