
If you're managing a project with multiple tasks and timelines, it can be difficult to keep everything organized. You’re managing different team members, juggling conflicting deadlines, and trying to keep the project moving forward as smoothly as possible.
Thankfully, Gantt charts offer an effective solution.
With a Gantt chart, you can visualize all your project tasks in a simple, visual format. You can track project progress, monitor your deadlines, and identify bottlenecks.
But if you’re new to Gantt charts, knowing how to use them effectively can be daunting.
In this simple guide, we'll explain what Gantt charts are, the benefits of using them, and how to create a Gantt chart of your own.
What is a Gantt chart?
A Gantt chart is a visual representation of a project timeline that outlines all the project tasks, milestones, and dependencies in a horizontal bar chart. Take a look at this image as an example:
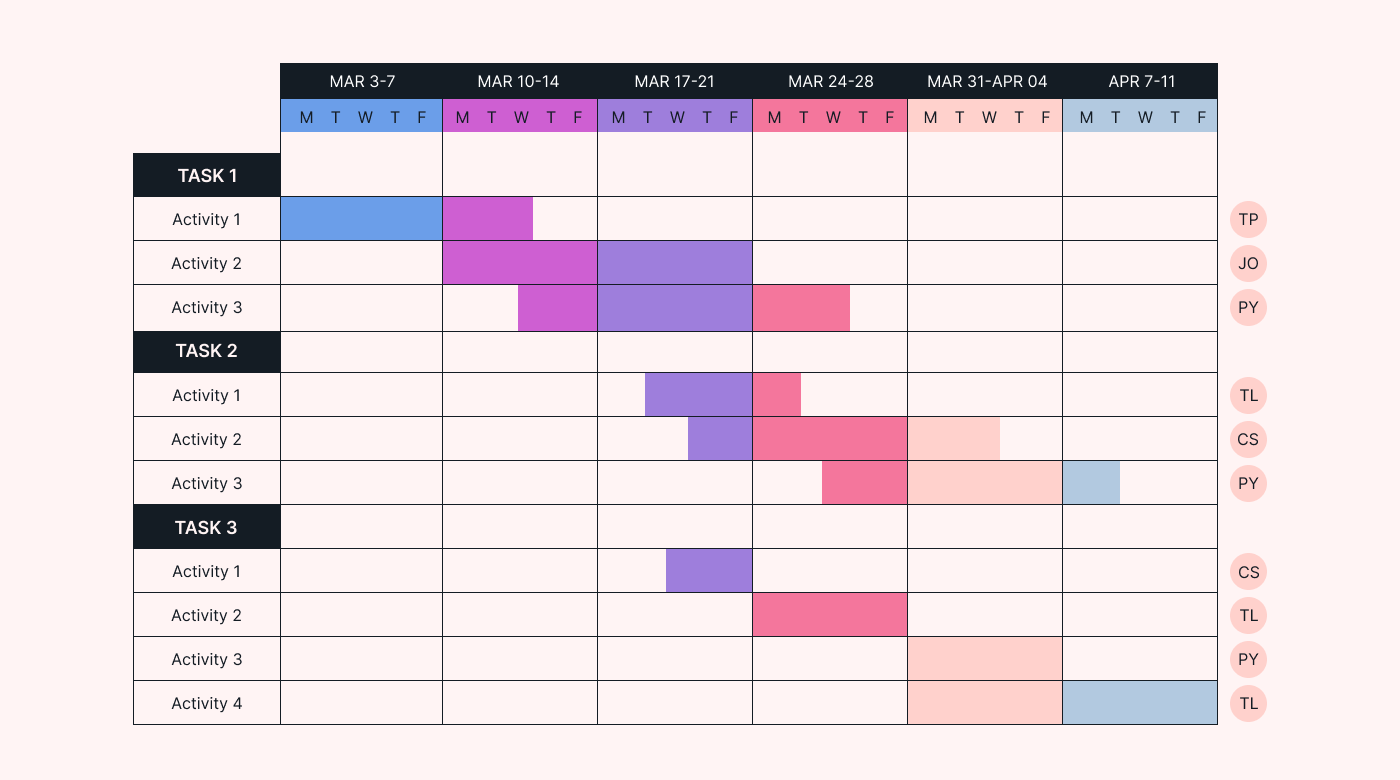 |
This simple format gives you a clear overview of project progress. You can see the current status of your project, who’s working on certain tasks, and whether there are any bottlenecks or delays.
If you do notice any delays, you can jump in to get things back on track with minimal delays.
Gantt charts were originally created by Henry Gantt in the early 1910s. He made the chart as a way to help managers schedule and track tasks in shipbuilding projects. Today, Gantt charts are helpful for project managers across a variety of industries.
What is an example of a Gantt chart?
Check out this Gantt chart example of a construction project to see how it works in action. The chart outlines all the tasks for the construction project, when they should start, and how long they should last.
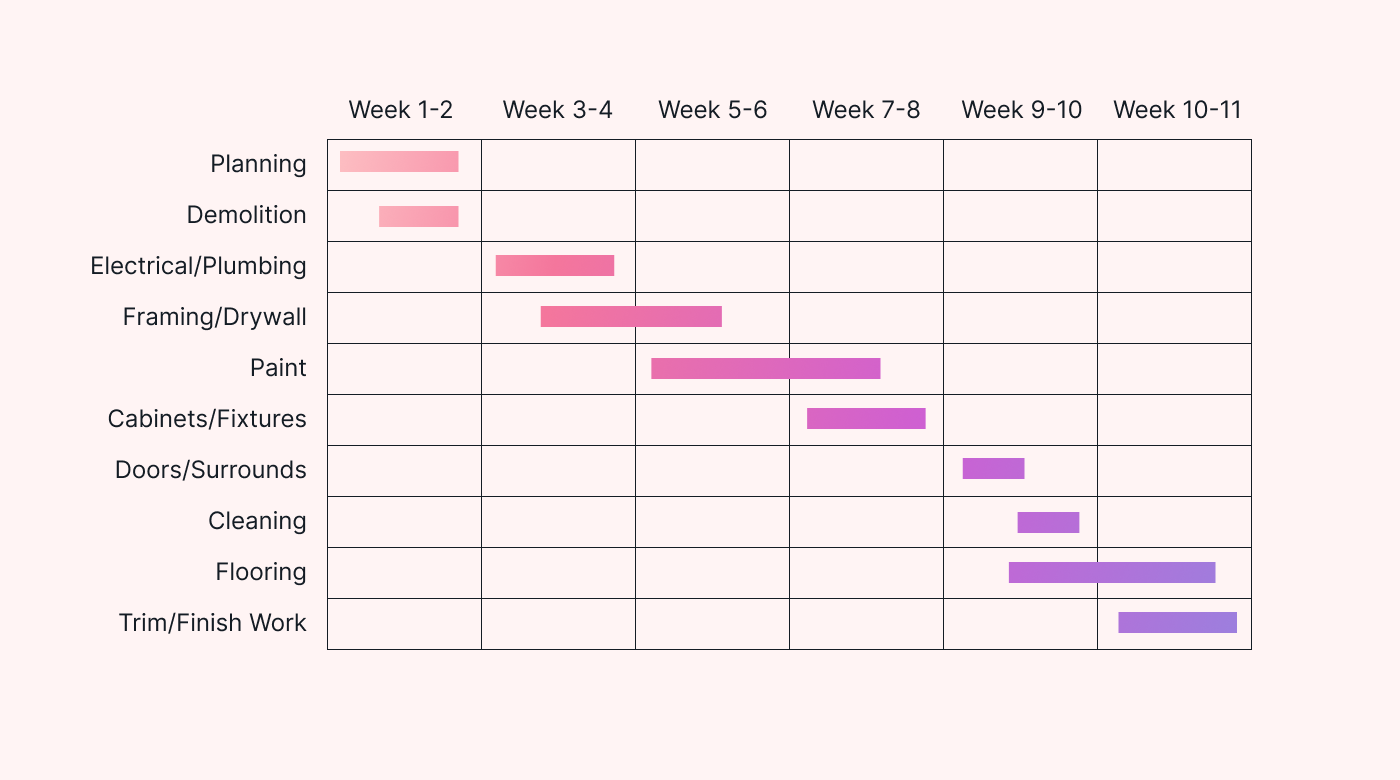 |
With this chart, the construction project manager can track when tasks should start, end, and where they overlap. This makes it easier to manage the project, track tasks, and make sure that everyone knows what they need to do and when to do it.
Plus, it helps manage stakeholder expectations by providing accurate, real-time updates. Instead of leaving them in the dark, you can share the chart to provide an overview of progress.
What are the benefits of using Gantt charts?
Take a look at some of the ways a Gantt chart is beneficial in project management.
- Visualize your project timeline. Gantt charts offer a simple and clear overview of your project timeline, tasks, and milestones. As a result, project teams can see project progress in a single glance.
- Simplify complex projects. A Gantt chart lays out all the tasks for a project in a single, visual format. This makes it easier for project managers to track complex projects (and make sure tasks are delivered on time).
- Spot dependencies between tasks. The layout of a Gantt chart helps project managers visualize dependencies between tasks. As a result, they can spot which tasks are reliant on others and even find the critical path.
- Pinpoint bottlenecks. With an online Gantt chart, you can instantly see where tasks are falling behind in your project. This means you can jump straight in to identify the cause of the delay and put things right.
Key components of a Gantt chart
A Gantt chart is made up of several key components, including taskbars, a timeline, and milestones.
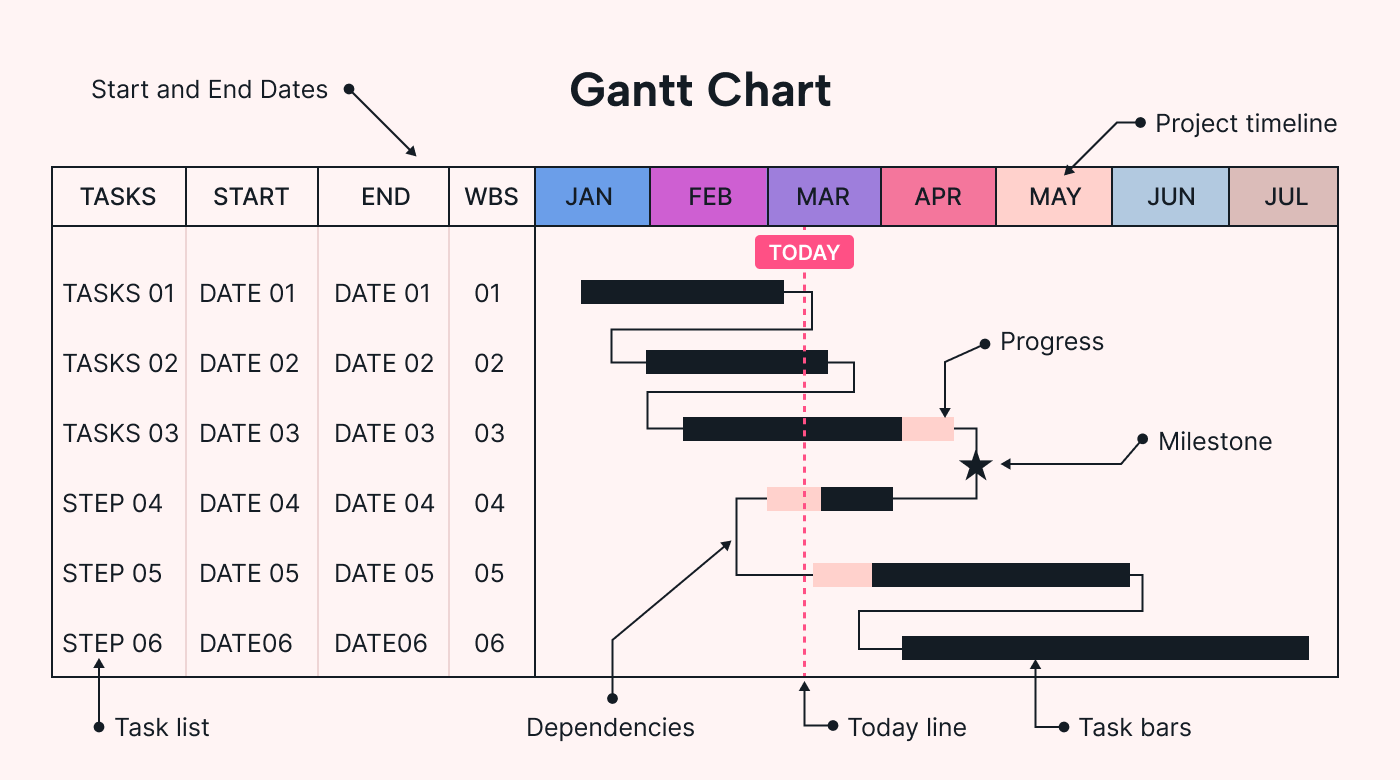 |
Let’s look at these (and a few others) in more detail.
- Task list. The vertical axis lists all the specific tasks or activities that need to be completed as part of the project.
- Project timeline. The horizontal axis (which can be above or below the chart) outlines the project timeline.
- Start and end dates. The date a task begins and ends that sits within the task list. This is an optional add-on.
- Progress. A visual of how much progress has been made on each task. This could be represented as a color change in the bar or a percentage that shows how much is complete.
- Taskbars. Bars that represent individual tasks on the chart. The start and end points of the bars indicate when the tasks begin, end, and how long they should take to complete (their duration).
- Task dependencies. Arrows or lines between task bars that highlight relationships between tasks.
- Project milestones. Significant events in the project that show key achievements or deliverables (often represented as diamond-shaped symbols).
- Today line. The line that moves through your Gantt chart shows you the current date.
Some Gantt charts may also include an overview of your resources, a label for each taskbar to show who it's assigned to, and a legend describing the symbols and other items included in your Gantt chart.
How to create a Gantt chart
Follow these steps to create a simple Gantt chart that reflects your project timeline.
Choose the right software
The first step is to make sure you have the right project management tools in place. This means finding software that makes it easy for you to create, manage, and share your Gantt chart.
But with so many platforms to choose from, it can be hard to find the best software for your business. To help you narrow it down, we've outlined some key features to look out for.
- Functionality. Do you want to drag and drop items in your Gantt chart? Would you like to automate parts of the project? Do you want to visualize your task dependencies? Think about the different types of functionality that you want from your Gantt chart software. Then, you can make sure you find a platform that has all the features you need.
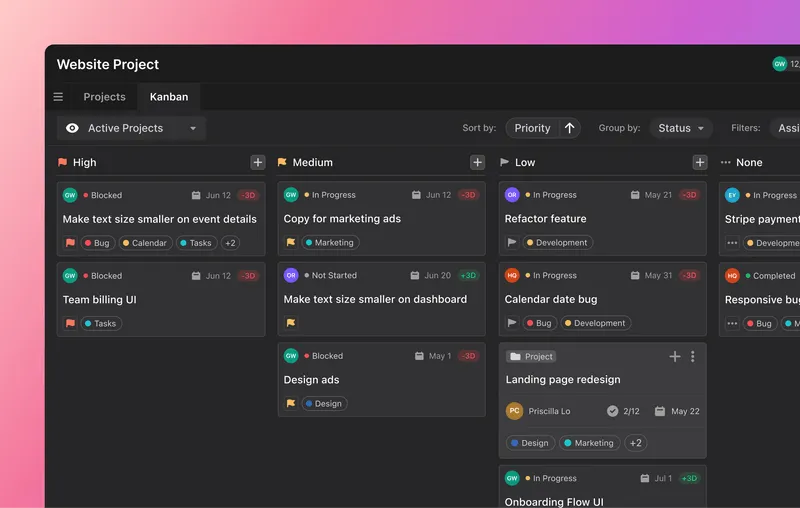
- Ease of use. An intuitive interface makes it easy for you to create, edit, and manage your Gantt chart. As a result, you’re able to update the Gantt chart and create a chart that accurately reflects your project. Take a look at Motion as an example of an online tool with a simple interface. Our software is easy to use and doesn't require hours of training to get started.
 |
- Ability to collaborate. Gantt charts allow teams to work together towards a common goal. So, when choosing Gantt chart software, you need a platform that allows you to be collaborative. Some collaborative features to look out for include sharing updates, getting real-time access to the chart, and adding comments and notes for other users.
Define your project scope
The project scope is a description of the work that needs to be done in a project. It covers your project goals, tasks, and expected outcomes. By clearly understanding your project scope, you make sure that your project stays on track and that you don’t miss any important tasks or deadlines.
Here’s how to tackle the project scope:
- Clarify your project objectives. Start by clearly stating your project’s purpose, goals, and objectives. This will outline why the project is happening in the first place, which will help you create a Gantt chart geared toward your desired outcome.
- List deliverables. Identify the specific deliverables for your project. For instance, if you’re launching a new product, your deliverable will be the tangible item you create. Properly identifying and documenting your deliverable keeps everyone on the same page and working towards the same outcome.
- Set boundaries. Boundaries define what’s included (and excluded) from your project. For example, let’s say you’re working on a web development app. The project includes app development, user-experience design, and user testing. It doesn’t include market research. By setting these boundaries, everyone in the project knows what they should (or shouldn’t) be working on. It also prevents scope creep and makes sure that everyone is performing the right tasks to complete the project.
Identify project tasks
With your project scope in place, you can now identify all your project tasks. This means outlining all the activities your project team must complete to reach the desired outcome of the project.
Here are a few tips for identifying your project tasks:
- Break down project deliverables: Review your project deliverables and break them down into smaller, manageable tasks. This will help you visualize everything you need to do to complete the project and make sure you produce each deliverable.
- Involve stakeholders. Talk to relevant stakeholders to get their input during this process. In doing so, you’ll make sure that you get a well-rounded perspective of what tasks must happen to complete the project. After all, no one is an expert in all parts of a project.
- Review previous projects. Take a look at similar projects from the past. You can then use this as inspiration for the tasks you’ll need to complete in your upcoming project.
After identifying all the tasks, you can simply add all the activities along the left-hand side of your chart.
Estimate task durations
Once you've identified the activities (tasks) for the project, you can estimate how long each task will take. By doing so, and adding everything together, you can confidently predict the overall length of your project, allocate resources effectively, and manage stakeholder expectations.
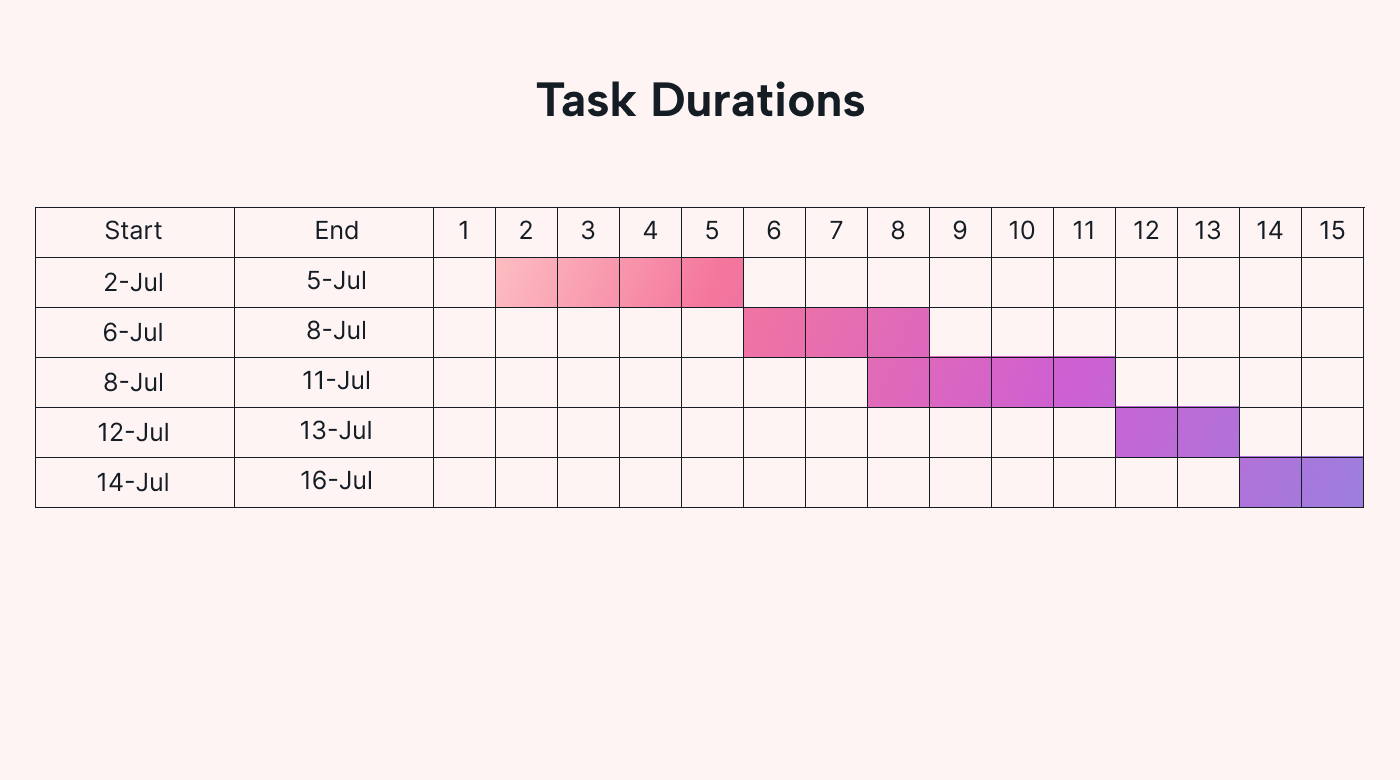 |
Here are some of the ways you can estimate task durations:
- Review previous projects. When you were trying to figure out which tasks to include in your Gantt chart, you might have looked back at previous projects for inspiration. The same principle applies here. Find similar tasks in past projects to see how long they took to complete. This will give you a better idea of how long tasks should take and help you create realistic estimates for task durations.
- Break tasks down. Divide tasks into smaller, manageable subtasks. This will help you visualize the time needed for each subtasks, which you can add together to estimate the full task duration. This process also makes sure that you've considered all aspects of the tasks, which helps you make accurate estimates.
- Consult with experts. Involve team members who have experience in the specific tasks to get their input. Their knowledge and insights on the tasks can help you accurately estimate task duration.
Determine task dependencies
Task dependencies are the relationships between tasks. For example, some tasks can only start when others have finished, and vice versa.
These relationships help you figure out the order of tasks, and which tasks are most important to delivering the project successfully. If one of your tasks can't start until another is finished, and that task is vital to the success of your project, it's clear that it's a top-priority task.
To find dependencies in your project, spend some time reviewing the relationships between your tasks. Are there certain tasks that can only start when another task ends? Or do you have tasks that must start at the same time?
Whatever it is, note it in your Gantt chart. That way, you can easily see which tasks are reliant on others and plan your work accordingly.
With all your task durations and dependencies in place, you can now outline your entire project timeline. This will sit along the top or bottom of your chart (you can choose which you prefer).
Identify project milestones
When you have a good idea of your project schedule, you can start to identify your project milestones.
Milestones are key points in your project that signify the completion of an important phase or deliverable. For example, in a construction project, a milestone could be completing the foundation of a new building.
You can have multiple milestones in a single project, but they should always represent meaningful progress in your project.
A diamond-shaped symbol is often used to show a milestone in a Gantt chart (although you can choose another symbol if you prefer). Adding a clear symbol makes it easy for you to instantly see where the milestones are and whether you're on track to hit them. If you're not, you can step in and make changes to get your project back on track.
Track your project progress in real-time with Motion
Gantt charts are a great way for teams to visualize project progress, collaborate throughout the project, and track updates in real-time.
To help you and your project team track progress in real-time, use a collaborative platform like Motion.
With our platform, you can easily view the progress of each task, share updates with your team, and make sure that everyone’s on track to reach the project goal. Plus, you can use our automation to streamline your work and speed up your task durations.
Try Motion for free to see for yourself.


