
Are you tired of sifting through countless spreadsheets, sticky notes, and project management tools while trying to manage your projects? Then check out our Gantt chart examples!
A Gantt chart is a way to show project tasks on a timeline. It visually depicts each task's start and end date, how long it'll take, and when it's due.
Gantt charts are valuable to a variety of industries, from construction to agency management. They also help consultants map out their work schedules, while businesses use them to manage the creation of project proposals and business plans.
If you're not using a Gantt chart yet, maybe it's time to consider one.
In this post, we'll provide Gantt chart examples for different use cases and explain how to create a Gantt chart using Excel or project management tools. We'll also explore the limitations of Excel Gantt charts and the advantages of using Motion for effective time management.
What is a Gantt chart?
A Gantt chart is a project management tool used to plan and visualize tasks over a specified timeline. It shows each task's start dates, duration, and end dates in a project schedule. A bar stretching across the timeline represents each task, showing how long it'll take. This makes it easy to track progress, as you can easily gauge whether each task is on time or overdue.
 |
In addition to the basic information about tasks and timelines, Gantt charts show dependencies between project tasks. For instance, if one task needs to be completed before another one can begin (e.g., buying materials before construction starts), this is indicated with an arrow connecting the two tasks in the chart.
Why is a Gantt chart important?
Gantt charts are essential for project planning, as they provide a concise visual overview of the project timeline and enable you to monitor progress. Here are some advantages of using Gantt charts for project management:
1. Visually track project progress
With Gantt charts, it's easy to see how much work has been done and how much is left to do in a project. You can also easily spot tasks running behind schedule or identify potential problems before they become major issues.
2. Plan dependencies between tasks
A Gantt chart makes it easier to plan dependencies between tasks, ensuring that activities happen in the correct order according to your schedule. This ensures efficient use of resources and helps to keep the timeline on track.
3. Streamline communication
A Gantt chart is a concise way to communicate the project schedule and project updates with everyone involved, from team members to stakeholders. This clearly lays out what needs to be done and makes it easier for everyone to understand how their tasks fit into the bigger picture.
Who uses Gantt charts?
Gantt charts are used by a variety of professionals, including project managers, event planners, consultants, designers, and business owners. They're an essential tool for anyone who needs to keep track of projects or plan events on a timeline.
Whether planning a large-scale construction project or designing a marketing campaign, Gantt charts will help you stay organized and on track. And with the right project management tools or Excel template, creating a Gantt chart is easier than ever.
Gantt chart examples
To get a better understanding of Gantt charts, let's take a look at some examples. Here are four different scenarios:
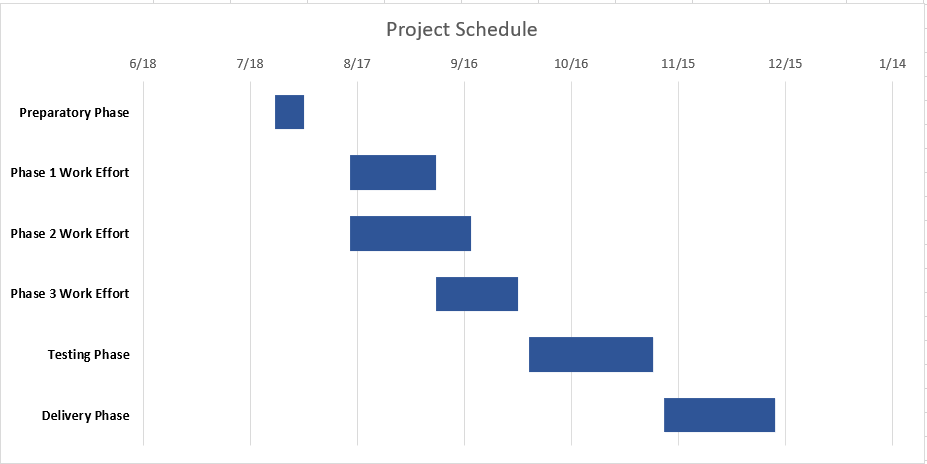
Gantt charts for construction
Construction projects involve a wide range of tasks, from obtaining permits and building materials to the workforce. Gantt charts help project owners, contractors, and project managers plan different phases of a construction project. It's essential for tracking progress, resource management, and meeting deadlines. It also ensures that tasks are completed in the correct order, so there aren't any delays due to missing pieces or incorrect sequences.
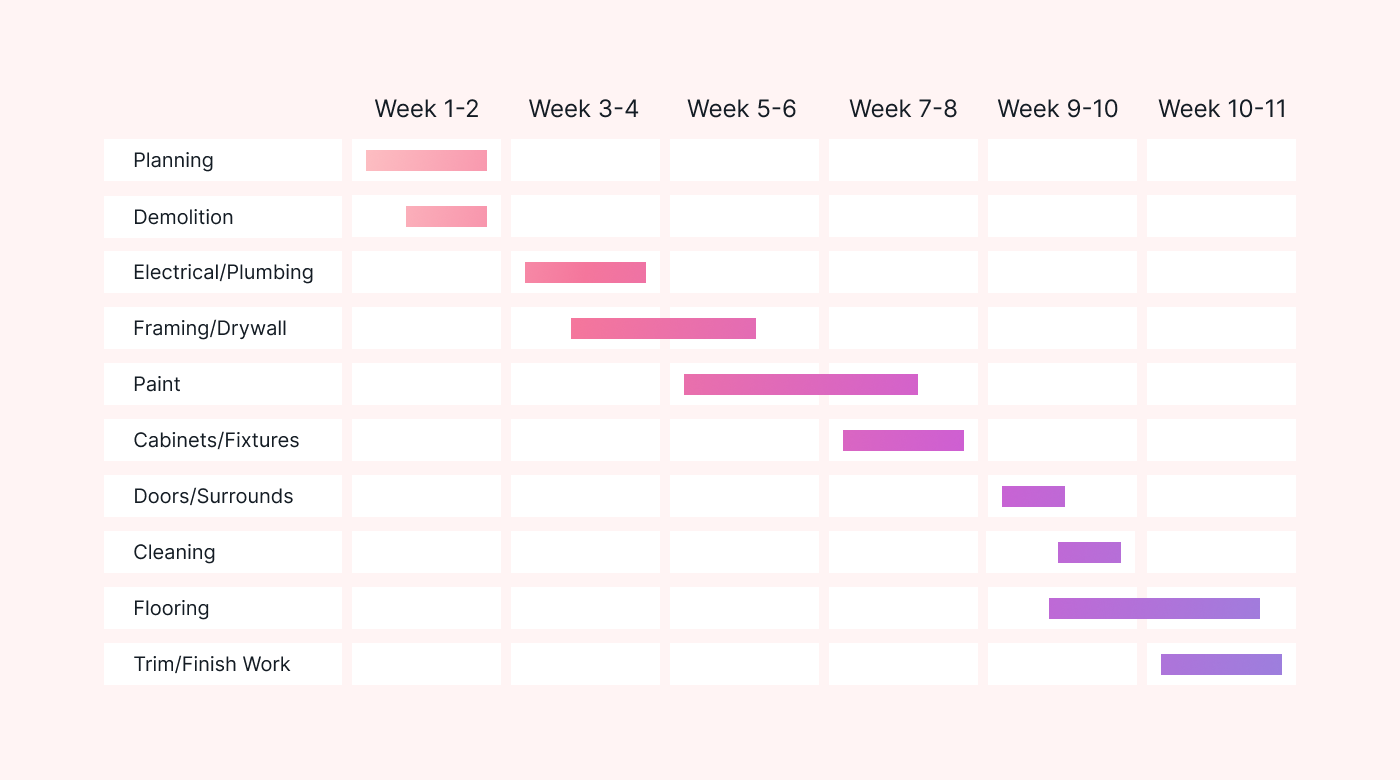 |
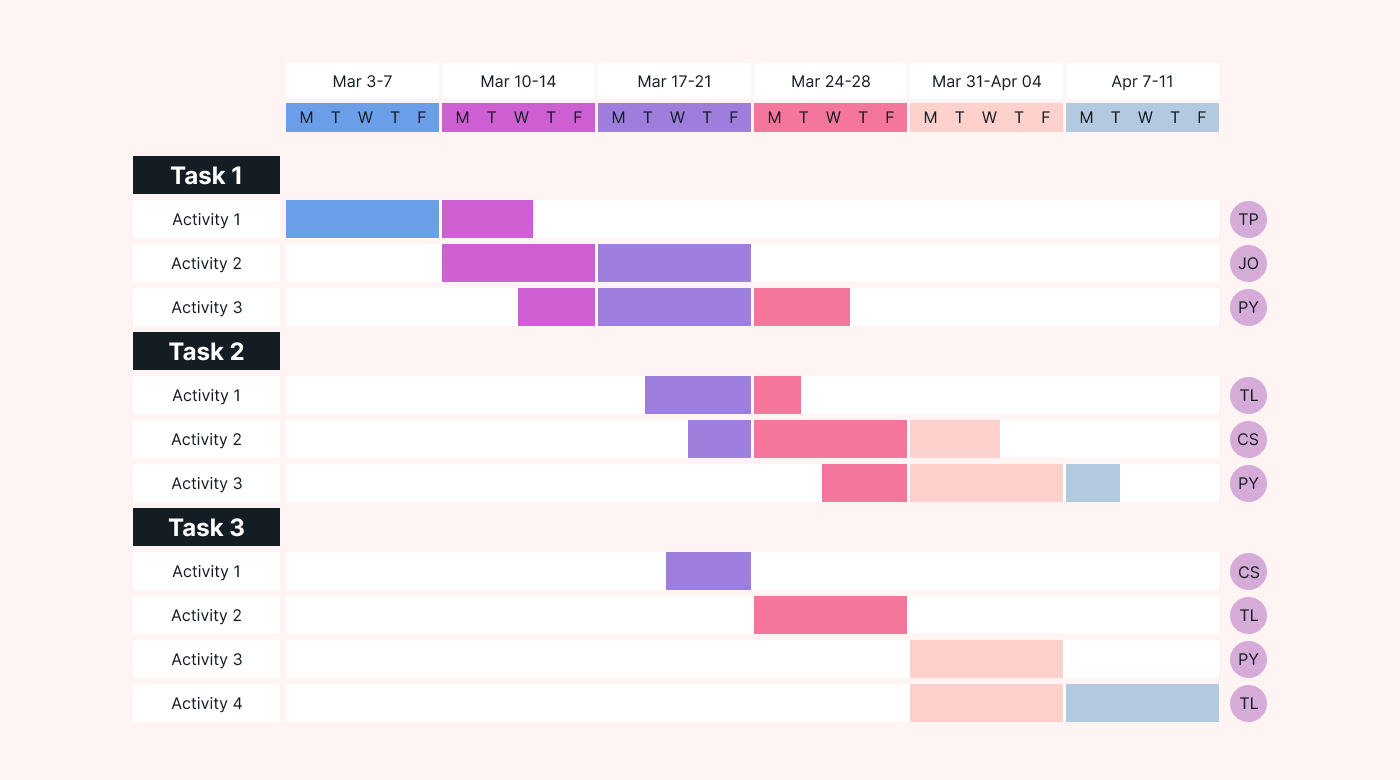
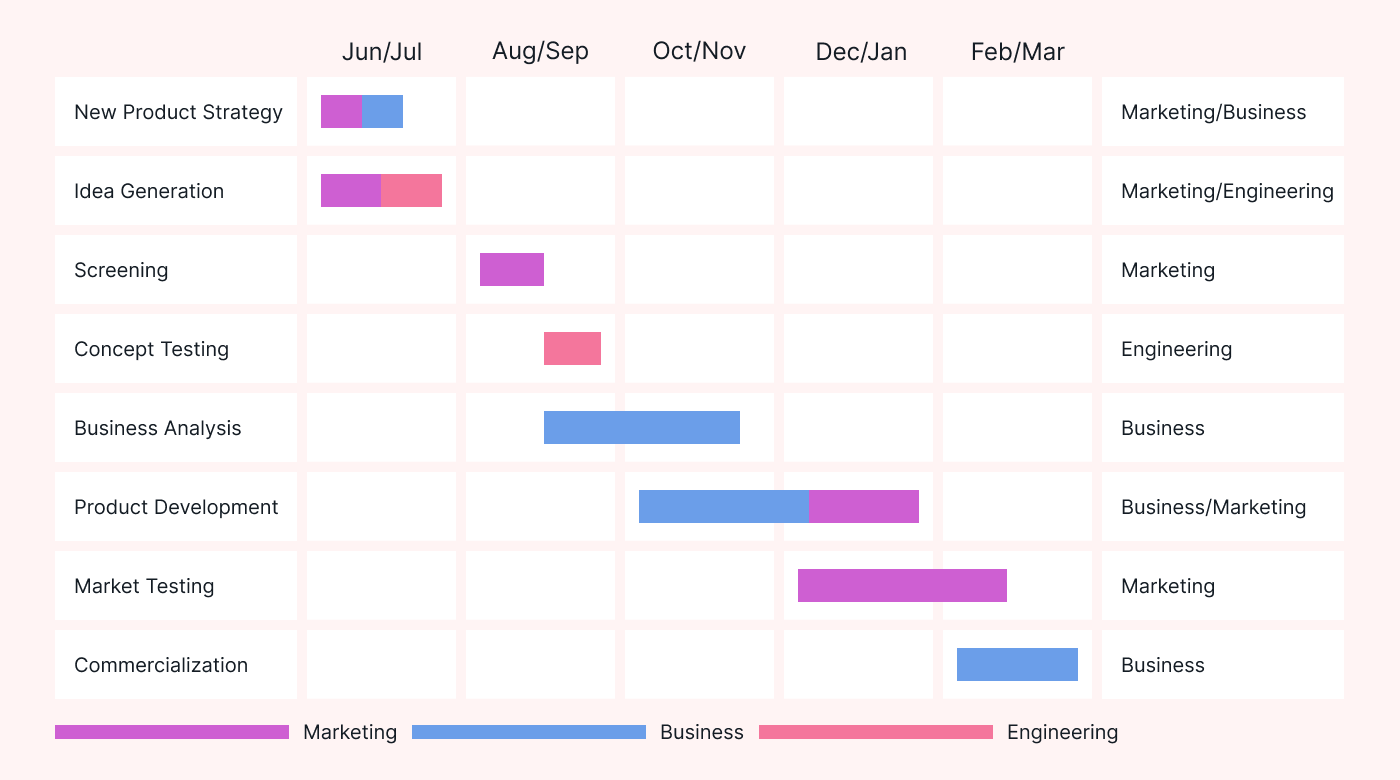
Gantt chart example for consultants
Gantt charts are used by consultants to create timelines for their projects. It helps them plan out the different stages of a project and track progress in an organized way. Consultants can also use Gantt charts to plan their workflow and ensure that tasks are completed on time, minimizing risk and ensuring maximum efficiency. Besides that, Gantt charts can easily be shared with stakeholders so that everyone is on the same page regarding the project's progress.
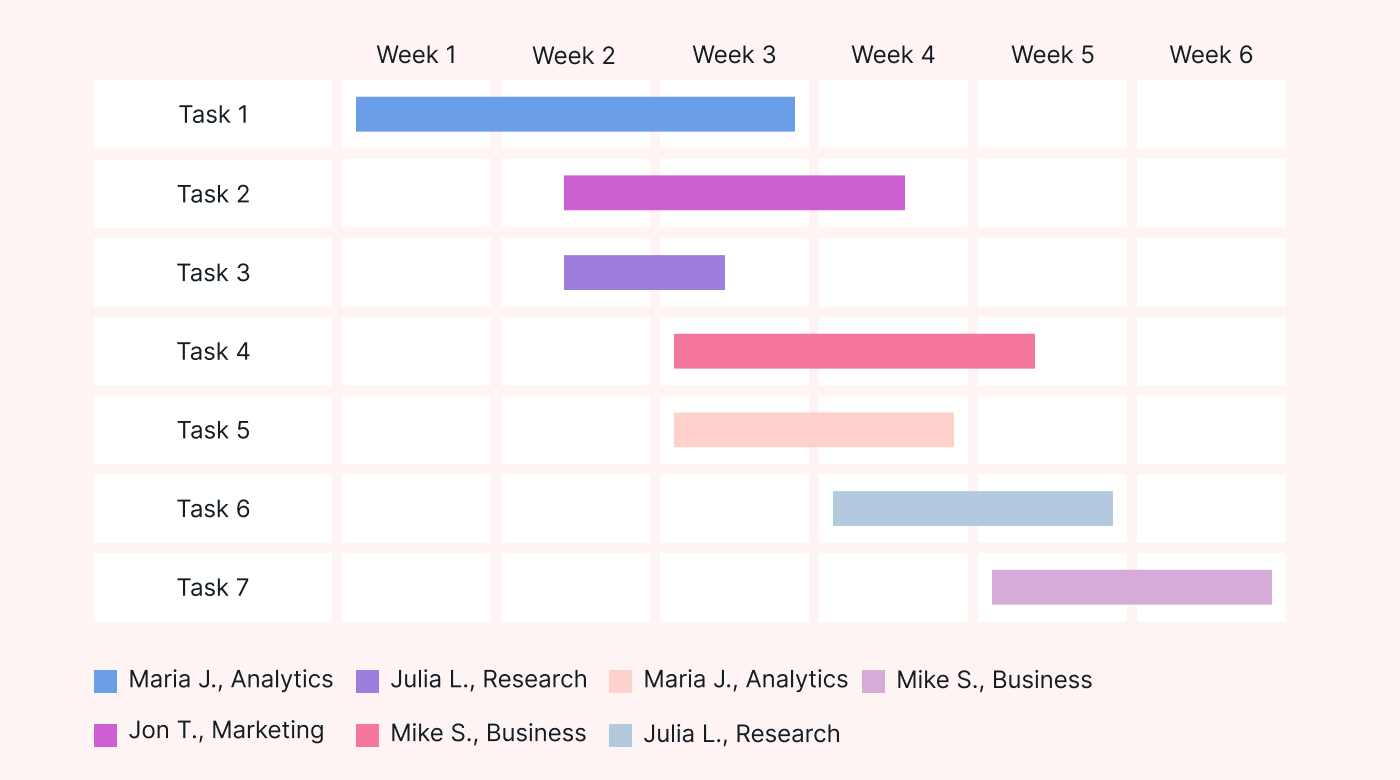 |
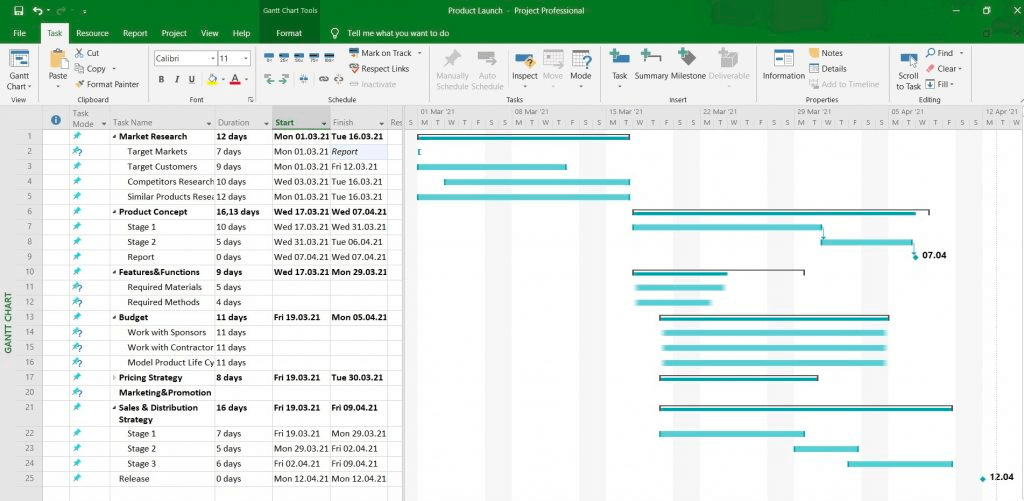
Gantt chart example for project proposals
Gantt charts are also used by project managers and a range of other professionals to create project proposals. In this case, the Gantt chart serves as a visual representation of the timeline and goals for each stage of the project. It helps convince clients that their projects can be completed in a timely manner with minimal risk. For example, once the due dates for your project proposal are clear, you can plan backward from it to ensure you get started at the right time. This provides a clear understanding between the client and the project manager or consultant on when tasks need to be completed and how much time is allocated for each phase.
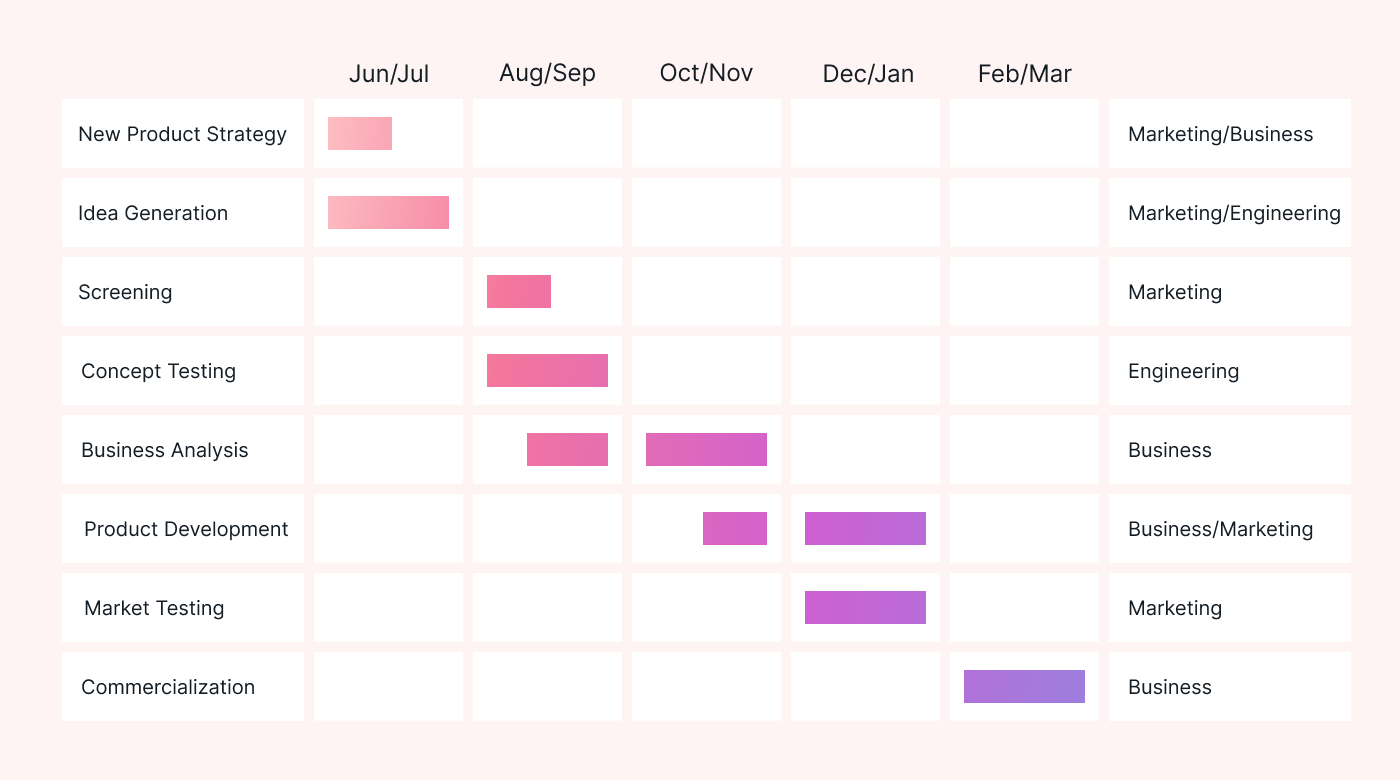 |
Gantt chart example for business plans
Business plans involve a lot of planning, and Gantt charts are essential for this purpose. You can use them to plan out the different components of your business plan, such as research and development, marketing strategy, customer acquisition, etc. With Gantt charts, you can track progress against these tasks to know precisely where you stand in achieving your goals.
 |
These example Gantt charts showed that from construction projects to business plans, Gantt charts are an invaluable tool for project management. They enable you to plan out tasks accurately and keep track of progress throughout the project. Whether working on a large-scale construction project or creating a business plan from scratch, Gantt charts can help you stay organized and ensure that tasks are completed on time.
How do I create a Gantt chart?
Now that you've seen some Gantt chart examples let's look at how you can create one for your projects. Two main ways to make a Gantt chart are in Excel or in project management software.
Create a simple Gantt chart using Excel
Excel is a popular spreadsheet software from Microsoft that everyone is familiar with. Hence, the most straightforward way to create a Gantt chart is by using Excel.
To do this, you'll need to:
- Set up and format your data in an Excel spreadsheet. This should include tasks, start and end dates, duration, and the task owner.
- Then insert a bar chart into the spreadsheet and customize it with your data. You can add different colors or patterns to differentiate between tasks.
- Adjust the format to look like a Gantt chart (i.e., adding task labels and changing scales and structures).
- Your chart is ready and can be shared with stakeholders and the project team.
With Microsoft Excel, you can create a simple but effective Gantt chart to help you stay organized and on track with your project.
Excel Gantt charts are limited
However, it takes quite a bit of time to create a Gantt chart in Excel, and Excel Gantt charts are limited in features and customization options. For example, it can be clunky to depict dependencies between tasks or display these task dependencies.
Furthermore, using Excel Gantt charts for larger projects isn't recommended, as the chart size will become too large to handle. And it's tedious to keep them updated and to share them with stakeholders.
Project management software with a Gantt chart feature
You can use project management software with a Gantt chart feature to make your life easier. This software enables you to plan, manage and monitor the progress of your entire project with ease.
It also allows you to:
- Create detailed timelines for tasks and sub-tasks
- Add task dependencies and milestones
- Assign resources to tasks
- Add a task status
- Set up notifications for upcoming deadlines
- Track progress and deadlines in real time
These features make staying organized, on track, and in control of your projects easier. Microsoft Project, Trello, Asana, Basecamp, and Wrike are key players in this field. All these have powerful Gantt chart capabilities that'll help you create professional-looking Gantt charts quickly and easily.
For professional project management, Gantt charts are an excellent tool for scheduling projects. Whether creating them in Excel or using project management software with a Gantt chart feature, they'll help you stay organized and ensure your project progresses according to plan.
Downsides of traditional project management tools
Project management software can be a great tool for managing projects, but there are some downsides to consider.
First, they require constant manual updates and prioritization, which can drain valuable time and resources. Additionally, progress update meetings are often still necessary, making the tool feel like an added hassle rather than a helpful resource.
Using these tools can also lead to micromanagement of your team, which can be detrimental to productivity and morale. Furthermore, teams may not regularly use or update these tools, rendering them less useful. Lastly, the need for multiple organizational tools can create staff confusion and frustration.
Let's ditch the traditional tools and explore better options for seamless project management!
Why Motion does a better job
Motion stands apart from the other project management software because it uses artificial intelligence to prioritize work and build schedules for your team. Commonly used project management platforms just store projects and tasks, so employees have to prioritize everything.
 |
Motion's machine learning algorithms prioritize these tasks and projects for employees based on factors like due date, start date, priority, and scheduled meetings so that teams always know which task they should work on next. It also automatically builds team members' schedules and shifts work when priorities change. When a meeting is scheduled over a task, Motion will also automatically reschedule it.
Finally, Motion gives everyone on your team one central place to manage their time and work - their calendar. This makes it easy to form new habits or update yet another tool, as nearly everyone already uses a digital calendar.
Motion does a better job than project management tools by providing a custom meeting booking page, automatically moving non-urgent meetings when more urgent tasks arise, and showing when project team members are over-committed or stuck in too many meetings.
Additionally, Motion applies productivity strategies such as time blocking and deep work to help teams maximize their productivity. Time blocking reserves time on the calendar for focused work, while deep work reserves chunks of time for difficult focus work. This way, teams can finish tasks faster and more efficiently.
Use Motion to super-charge your time management
Project management can often feel like a Sisyphean effort, but with Gantt charts, project management doesn't have to feel like a daunting task. Visualizing the workflow with a Gannt chart can help you create an action plan with manageable tasks and milestones. And no more endless spreadsheets and post-it notes!
And with Motion, no more endless spreadsheets and post-it notes: Motion makes organizing your calendar and tasks effortless.
Whether you're managing a group project or personal planning, let Motion help make it manageable. Motion makes organizing your calendar and tasks effortless.
So what are you waiting for? Try Motion today to see how our elegant and AI-driven solution can enhance productivity.


