Are your business processes inefficient, complex, and time-consuming? If so, you’re not alone. Intricate processes can be difficult to manage, often leading to mistakes and delays. This cycle of inefficiency can drain your team’s energy. It can also harm product delivery, customer satisfaction, and revenues.
Break the cycle with a process flow chart!
This powerful tool helps you identify inefficiencies and understand how each step affects the next. It allows you to create a blueprint for improving efficiency in your processes.
In this article, we’ll look at how to use a process flow chart to its full potential. Plus, we’ll give real-world examples of process flow charts in action.
What is a process flow chart?
A process flow chart is a tool that visualizes the steps in a process, system, or project. It provides a straightforward explanation of all the actions needed to complete a task. The chart outlines various critical stages of a business process, including inputs, outputs, and decision points. It can simplify complex processes by using symbols and arrows to show the flow of materials, information, or people. The chart ensures everyone is on the same page and can use the information to understand and improve the process.
 |
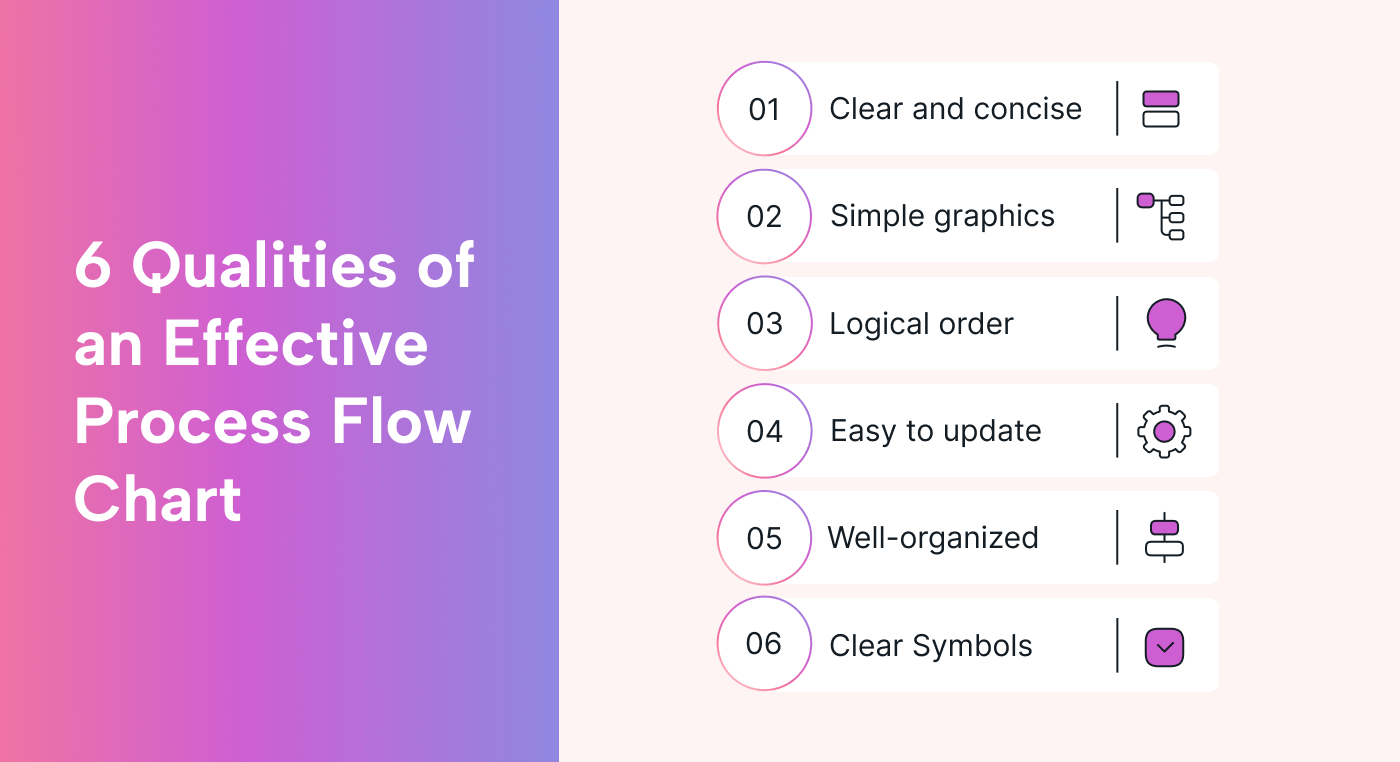
Qualities of an effective process flow chart
An effective process flow chart is a must-have for any business. It helps maximize efficiency by making sure tasks are completed accurately. Here are some characteristics of a successful process flow chart.
Clear and concise
An effective process flow chart must be easy to understand by all stakeholders involved in the process. It should articulate the process flow simply. This helps leave no room for assumptions or guesswork.
By being clear, you also ensure there's no misinterpretation or misunderstanding. And conciseness will help you prevent information overload.
Uses simple graphics
When creating a business flow diagram, using simple flowchart shapes to represent each step in the process is vital. The visuals make information more accessible and easier to understand. Simple graphics, such as arrows, boxes, and symbols, can be used to denote actions and decisions. The use of simple graphics enhances the overall professionalism and readability of the chart.
Follows a logical order
The sequence of steps in a process should be ordered logically (sequentially). This will help you identify constraints, inefficiencies, and areas for improvement.
Easy to update
As businesses grow and evolve, so do their processes. A process flow diagram should reflect the current state of processes, but be flexible and scalable. If it's difficult to update the chart, it can quickly become outdated and unusable.
An easy-to-update chart provides the flexibility required to keep pace with ongoing changes and can be valuable in keeping your team aligned and operating efficiently.
Well-organized and easy to follow
A well-organized process flow chart has all the workflow steps in a logical order (and well-defined), which will help users navigate and understand the workflow. This, in turn, will reduce the risk of confusion and errors.
 |
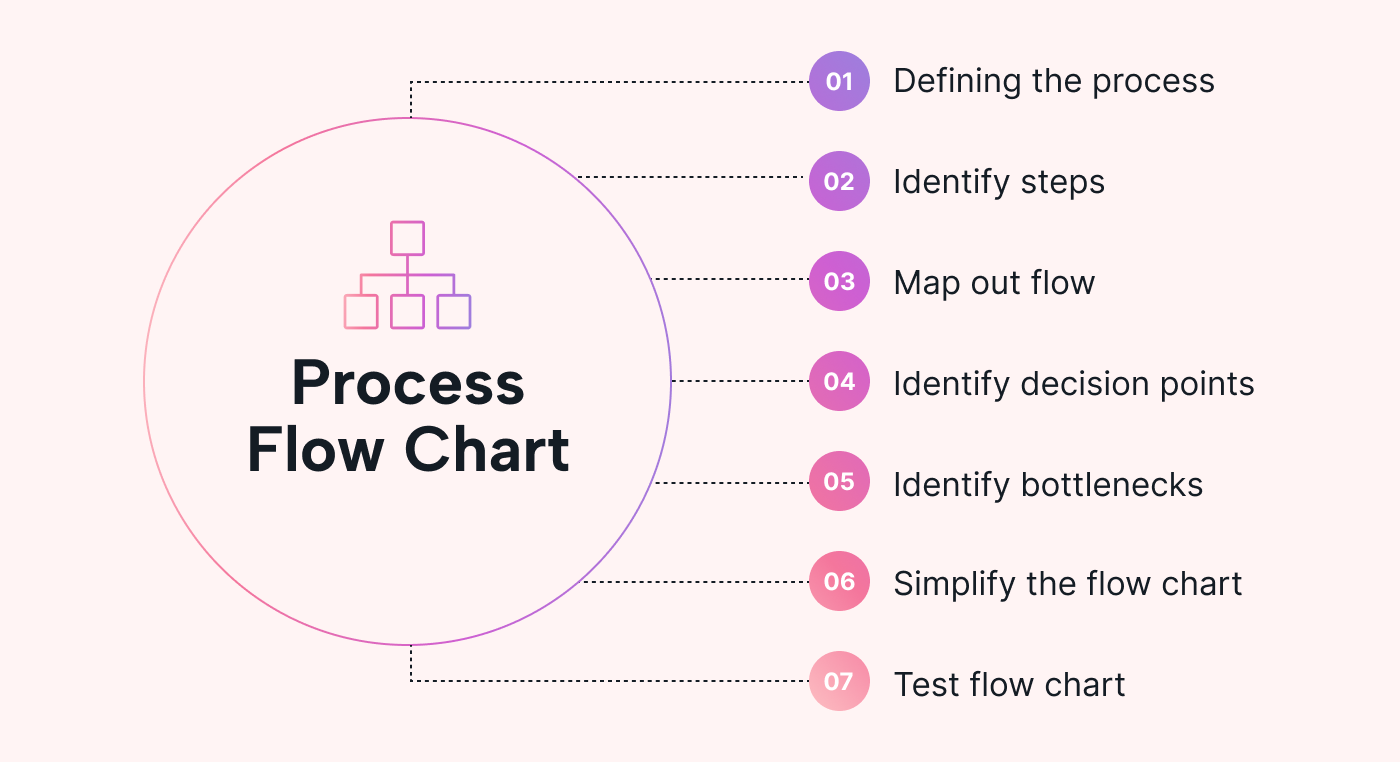
Tips for optimizing your process with a process flow chart
By optimizing your processes, you can remove unnecessary steps, reduce waste, and identify areas for improvement in your operations. Here are some tips for streamlining your workflows using process flow charts.
Determine the processes to be optimized
First, you have to determine which business processes you want to improve. To do so, you need to analyze the entire range of workflows within the organization. During the analysis, engage with all stakeholders to get a detailed view of the processes, including pain points, key players, and outcomes.
With this insight, focus on the business process with the greatest potential for improvement. For example, processes, where you can improve efficiency by saving time or reducing costs, are easy targets for improvement.
Identify the steps involved in the process
You'll want to make sure you understand all the steps in the processes you aim to optimize. To do so:
- Start by defining the objective of the process. Make sure the process actions align with the desired outcome.
- Break the process down into detailed steps and identify the inputs, outputs, and stakeholders involved.
- Gather input from those involved with the process. This will ensure you've covered all the necessary steps and avoided potential pitfalls.
Map out the process flow
Mapping out the process flow of a complex process involves creating a visual representation of the steps and activities of that process. To map out the flow, sequence the tasks that make up the process in a logical order and establish the connections between them.
This exercise will help you understand how the elements of the process relate to each other and identify what is working (and what is not working).
Identify decision points
Decision points represent a choice in the process (which can impact the outcome). They can take many forms, from relatively minor decisions such as how to label a product, to higher-level ones such as choosing a supplier.
To identify decision points, determine where specific inputs and outputs are required to drive the workflow forward. You can explore options at these points and choose the best path forward, which can improve efficiency and productivity.
Identify bottlenecks
Bottlenecks refer to the constraints that limit the overall performance of a process.
To identify a bottleneck, determine if tasks take longer, or require more resources than others. Look for pileups in the process flow and steps that have long wait times. By pinpointing these constraints, you can allocate more resources (and time) to them, which can result in a leaner and more efficient process.
Simplify your flow chart
A simplified flow chart can improve communication and understanding among team members, reducing the likelihood of errors. This will also help you find (and fix) process issues quickly.
Test your flow chart
Test your process flow chart by sending work through and observing closely. Make sure the process steps are in the correct order and all connections have proper labels.
You also might want to test different scenarios to verify that the chart covers all possible situations. This step will help you identify potential issues (and adjust) before they become problems.
 |
Examples of 5 industries that implement process flow charts in their operations
In today's world of complex operations, flow charts are becoming a staple in many industries. They provide clarity and structure and allow businesses to coordinate departments and stakeholders. This is important when creating new products or services.
Here are some examples of process flow charts in various industries.
1. Healthcare
The healthcare industry uses process flow charts in diverse operational processes to enhance the efficiency and quality of patient care. For example, they can visualize a patient's journey, from admission to discharge (and pinpoint areas that need improvement).
Process flow charts are also used in emergency rooms, where time is of the essence. By mapping patient flow, staff can improve triage protocols and reduce wait times.
The process flow chart can also be a valuable training tool for medical personnel. Understanding the detailed steps of some medical procedures can be the difference between life and death.
2. Construction
Process flow charts help keep construction projects organized. Flow charts can map out the steps of a construction project, including site preparation, laying the foundation, framing, electrical installation, plumbing, and finishes. They also help identify potential bottlenecks and redundant process steps, which can save time and money.
Flow charts also ensure local regulations are followed and help optimize the allocation of resources.
For this and other examples, process flow charts are a great communication tool. You can use them to make sure all stakeholders, including architects, engineers, contractors, and clients are all on the same page.
3. Manufacturing
Manufacturing companies use process flow charts in various manufacturing processes including assembly lines and supply chain management. They do so to communicate instructions to employees and provide a standardized approach to production.
Car manufacturing plants use process flow charts to plan assembly lines, which ensures an optimized production approach. This can help save time, drive better decisions, reduce costs, and improve the quality of their products.
And food production companies use flow charts to maintain quality control and track the progress of raw materials throughout the production cycle.
4. Financial industry
The financial industry uses process flow charts to visually represent complex processes, transactions, and workflows. These may include risk management, loan processing, and investment management.
Flowcharts are great tools to identify inefficiencies in processes. For example, they might highlight lengthy wait times for document processing or incomplete applications for loan processing. Not only will fixing these inefficiencies improve turnaround times, but it'll also make customers happier.
And just like in the construction industry, process flow charts can help financial institutions meet regulatory requirements (and ensure they remain compliant).
5. IT Industry
IT companies use process flow charts to map out software development. These flow charts may include gathering requirements, designing a solution, building the software, and testing. By analyzing the flowchart, IT companies can pinpoint areas where delays or errors occur (and fix them).
For IT support teams, flow charts can illustrate the troubleshooting steps a technician should take when helping a customer with a technical issue. This will minimize the risk of oversight (and make the technician's job easier).
 |
Technologies that can help boost process flowchart efficiencies
Creating and maintaining effective flowcharts can be a time-consuming process. This is when dealing with complex flowchart diagrams that need constant adjustments. Fortunately, there are technologies available that can boost flowchart efficiencies, including:
Project and workflow collaboration software
Collaboration software provides teams with a centralized, collaborative platform to manage their projects and workflows.
For example, Motion provides an intuitive platform for seamless communication, idea-sharing, task management, and file-sharing across departments with real-time collaboration and workflow automation. This cuts duplication and makes for quicker decision-making. Also, Motion allows for the integration of multiple software platforms, which means team members can work together on different applications at the same time.
Data visualization software
These tools help transform raw data into visual representations, which enable organizations to understand complex data sets and identify areas of improvement. These tools can also help you make data-driven decisions (to optimize business operations) quickly and in real time. By doing so, they can help reduce delays and improve the overall productivity of the organization.
For example, Tableau can help create interactive dashboards and reports, which allow you to identify data trends, patterns, and anomalies. Tableau also offers a variety of charts, graphs, and maps. These make it easy to convey complex information in a simple and intuitive manner. Tableau's versatility, ease of use, and dynamic interface make it a suitable tool for organizations looking to efficiently analyze data to stay ahead of their competitors.
Process Mapping Software
Process mapping software helps document processes from start to finish. It visualizes the workflow and its dependencies, helps to identify bottlenecks and inefficiencies, and provides a way of optimizing the process. Moreover, the software helps streamline workflows by removing redundancies and reducing errors. Removing those inefficiencies can, in the long run, reduce costs, increase profitability, and enhance customer satisfaction.
LucidChart is a powerful process mapping software that has drag-and-drop functionality and pre-built templates, making it easy to create easy-to-understand process maps. LucidChart also integrates with other tools, which makes it a perfect solution for dissecting (and enhancing) your process mapping capabilities. It also has automated data linking that makes it easy to gather information in real-time and analyze data. Its advanced sharing functionalities enable easy teamwork when determining the root cause of any problems or bottlenecks, and developing strategies to address them.
Enhance your operational efficiency with process flow charts
A process flow chart is a great tool to help you simplify and streamline your processes by breaking down complicated workflows into detailed, intuitive tasks.
With your list of tasks, Motion can help you easily prioritize, assign and track those tasks with AI-powered task scheduling and optimization.
Also, with Motion's collaboration feature, you can share your process flow charts with team members (and collaborate in real time to make updates and adjustments).
Try Motion for free for seamless process flows.


