
While energy, expertise, and enthusiasm get you started, efficient business processes will keep you going.
Process mapping can save time, energy, and money and make your team more efficient and productive.
The catch?
Documenting business processes is complicated enough. Now imagine having to learn how to map processes, too. But don't worry, we've got you covered.
In this article, we’ll share with you the six types of business process mapping examples. Learn how each type works, how to use them, and easily integrate them into your business.
What is process mapping?
Process mapping is a visual presentation of a business process. Think of it as a flowchart outlining each step, decision, and involved party. The objective is straightforward: to capture the entire process visually so anyone can understand it at a glance.
Specifically, process mapping aims to identify:
- The most important aspects of a business process for achieving desired outcomes.
- Inefficiencies such as bottlenecks, redundancies, and limits holding the process back.
It condenses complex workflows into an easily digestible form. You could spend hours explaining your software development process or just hand them a process map.
Process map glossary
When going through a process map, circles, squares, and diamonds aren't just random shapes.
They’re Unified Modeling Language (UML) symbols. UML symbols act like the grammar of process mapping, giving shape to key concepts like steps, decision points, and team roles.
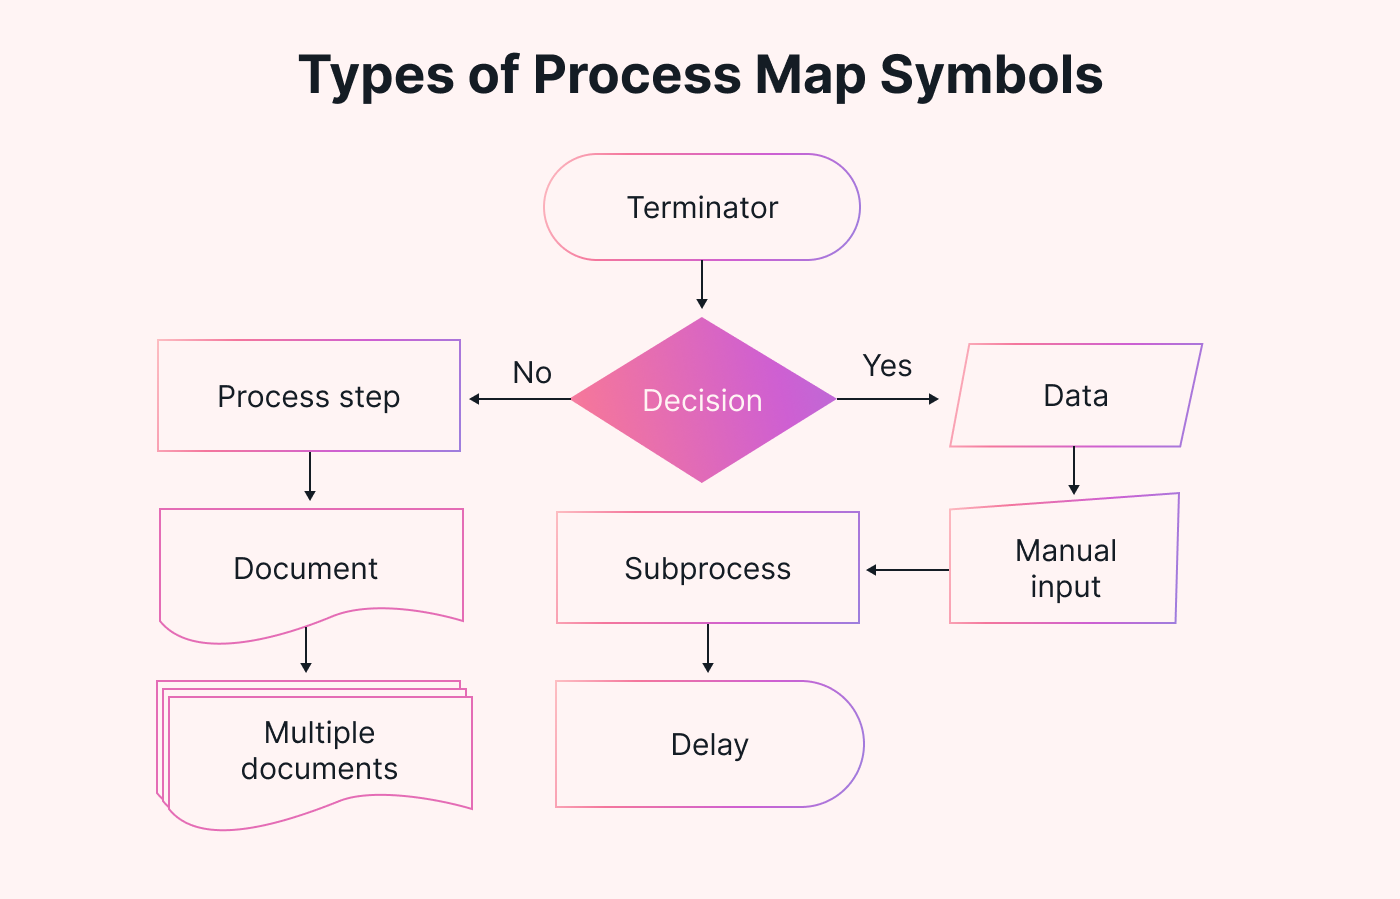
So, how do these symbols look in the wild? Let’s break it down:
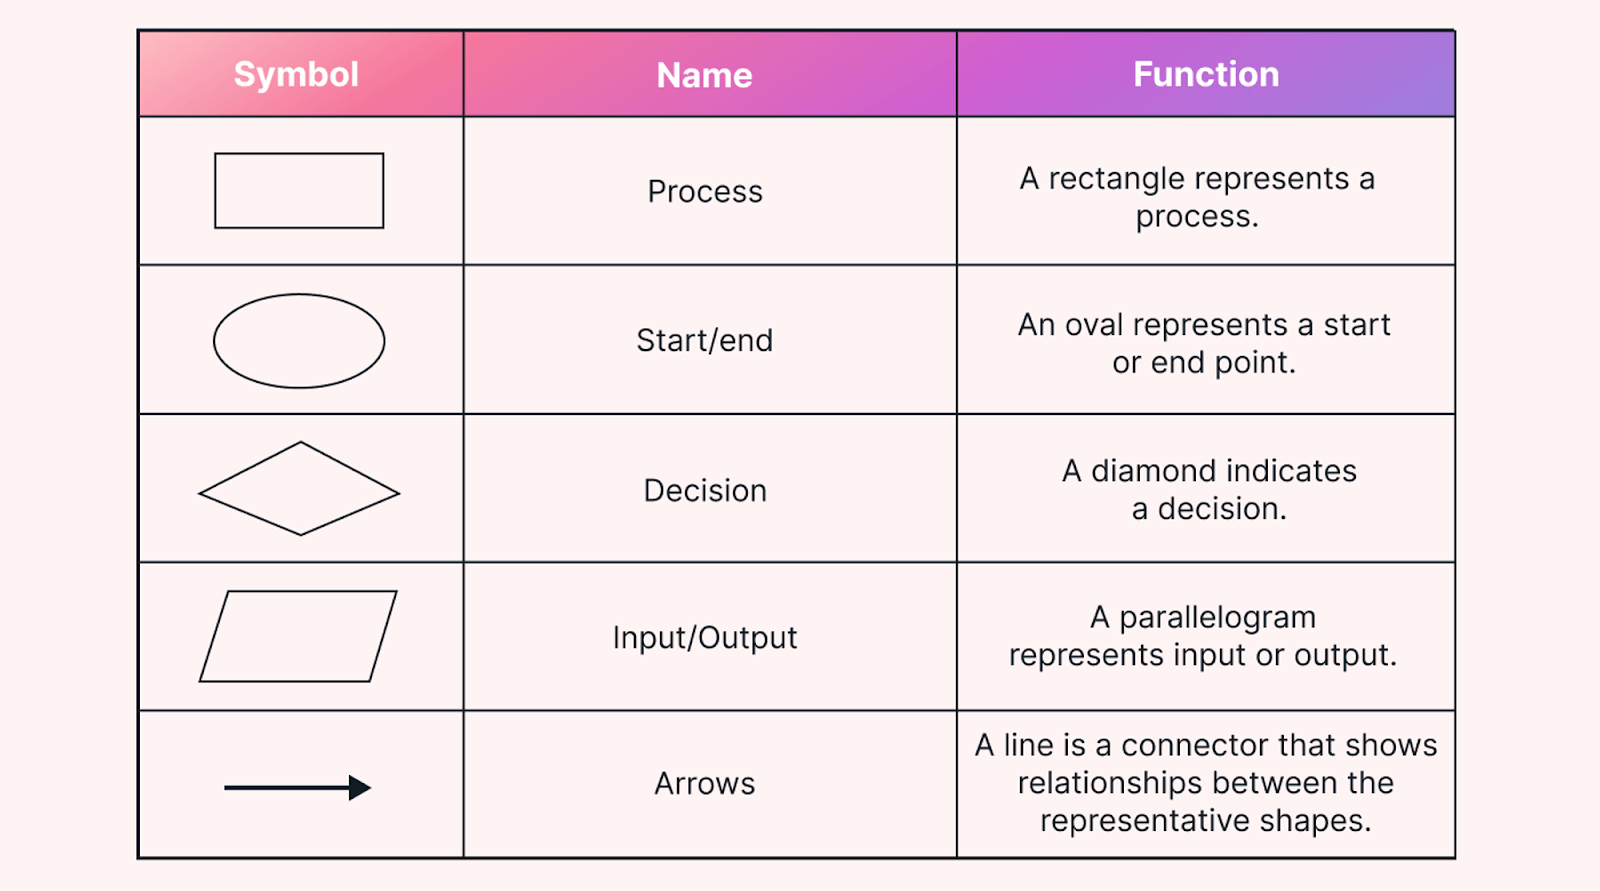
There are four main elements to a process map:
- Activities: These are the tasks or actions performed. Think of them as the "doing" parts of your current process.
- Artifacts: The tangible outputs or documents produced due to the activities.
- Events: These are things that happen while a process is happening, often stopping activities.
- Flows: The direction or sequence in which the activities and events proceed.
Process mapping examples by type
Let’s look at the six types of process mapping, accompanied by a detailed example of each.
1. Flowcharts
A flowchart is essentially a visual representation of a process. It’s one of the most straightforward types of process maps. It describes the steps and decisions you'll take from start to finish.
The aim is to create a streamlined guide that anyone can follow, making processes more efficient and less prone to errors.
So, where do flowcharts fit in an organization? Everywhere. From developers drawing new features to Scrum masters coordinating sprints to product owners prioritizing backlogs, they clear a path through what needs to happen.
Example: here’s a flowchart of a payment process:
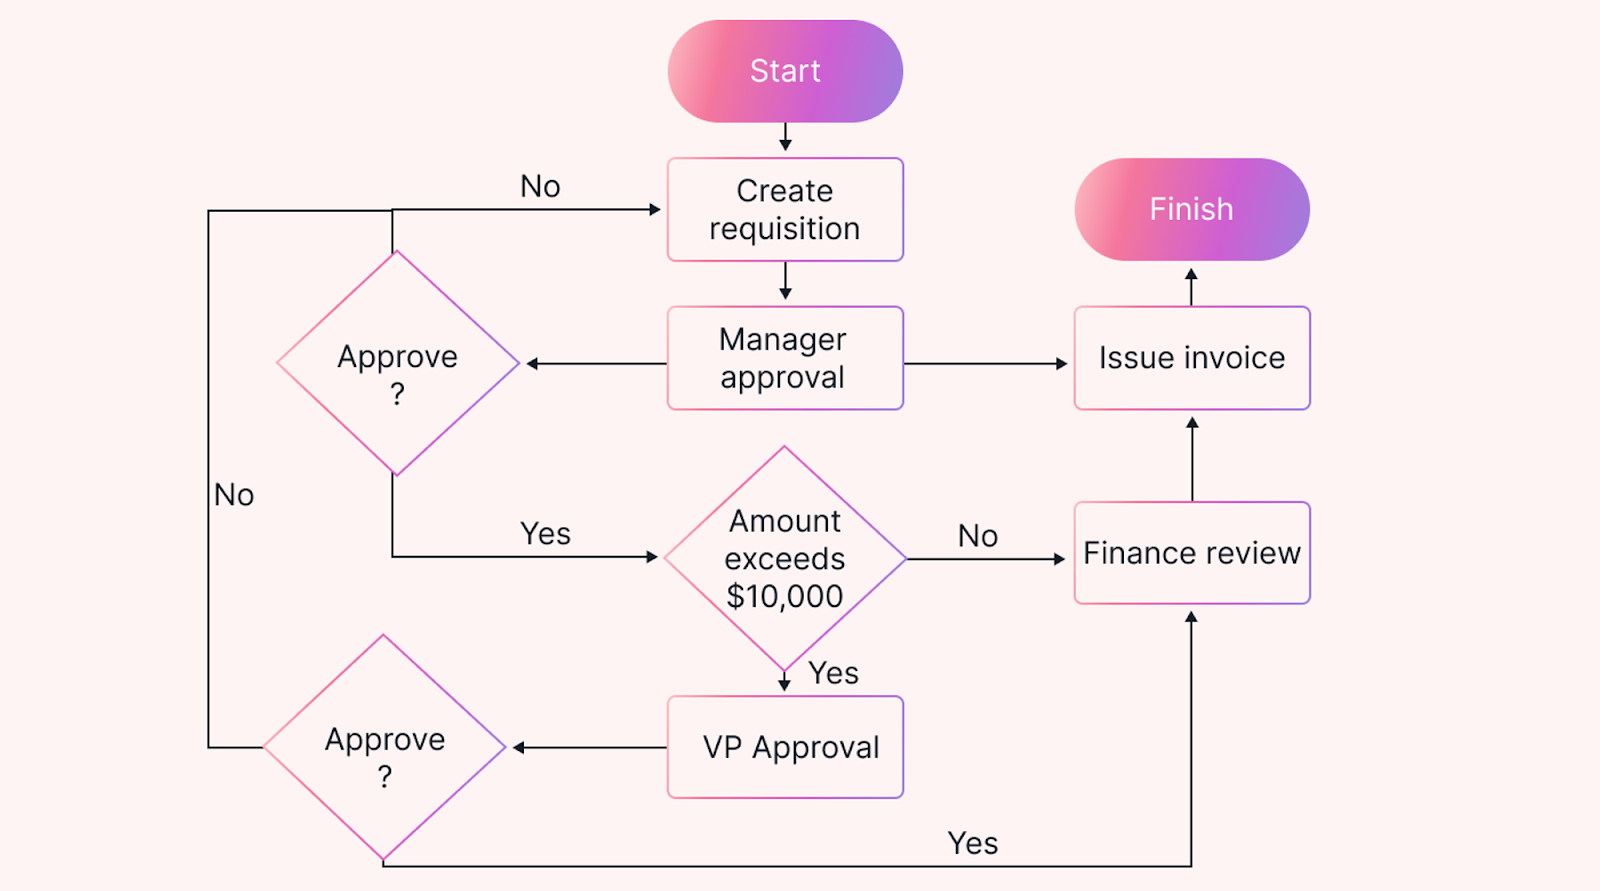
The flowchart outlines a six-step workflow for a payment process, starting with a "Start" circle and featuring two key decision points. Each decision point leads to a different predicament.
The workflow provides a structured approach for managing the payment process, with multiple gates for internal approvals.
2. Swimlane diagrams
Swimlane diagrams serve as an extension to the conventional flowchart. You can think of them as a flowchart that got promoted. It lays out the process steps and segments them based on who's responsible for what.
The main goal here is to visualize accountability. It's like a highway where each lane has rules about who belongs in it.
Example: Here’s a process flow diagram that outlines the steps involved in a training process within a company.
The diagram is divided into sections representing different departments or roles: "Each Department," "HR Department," and "Company Leader."
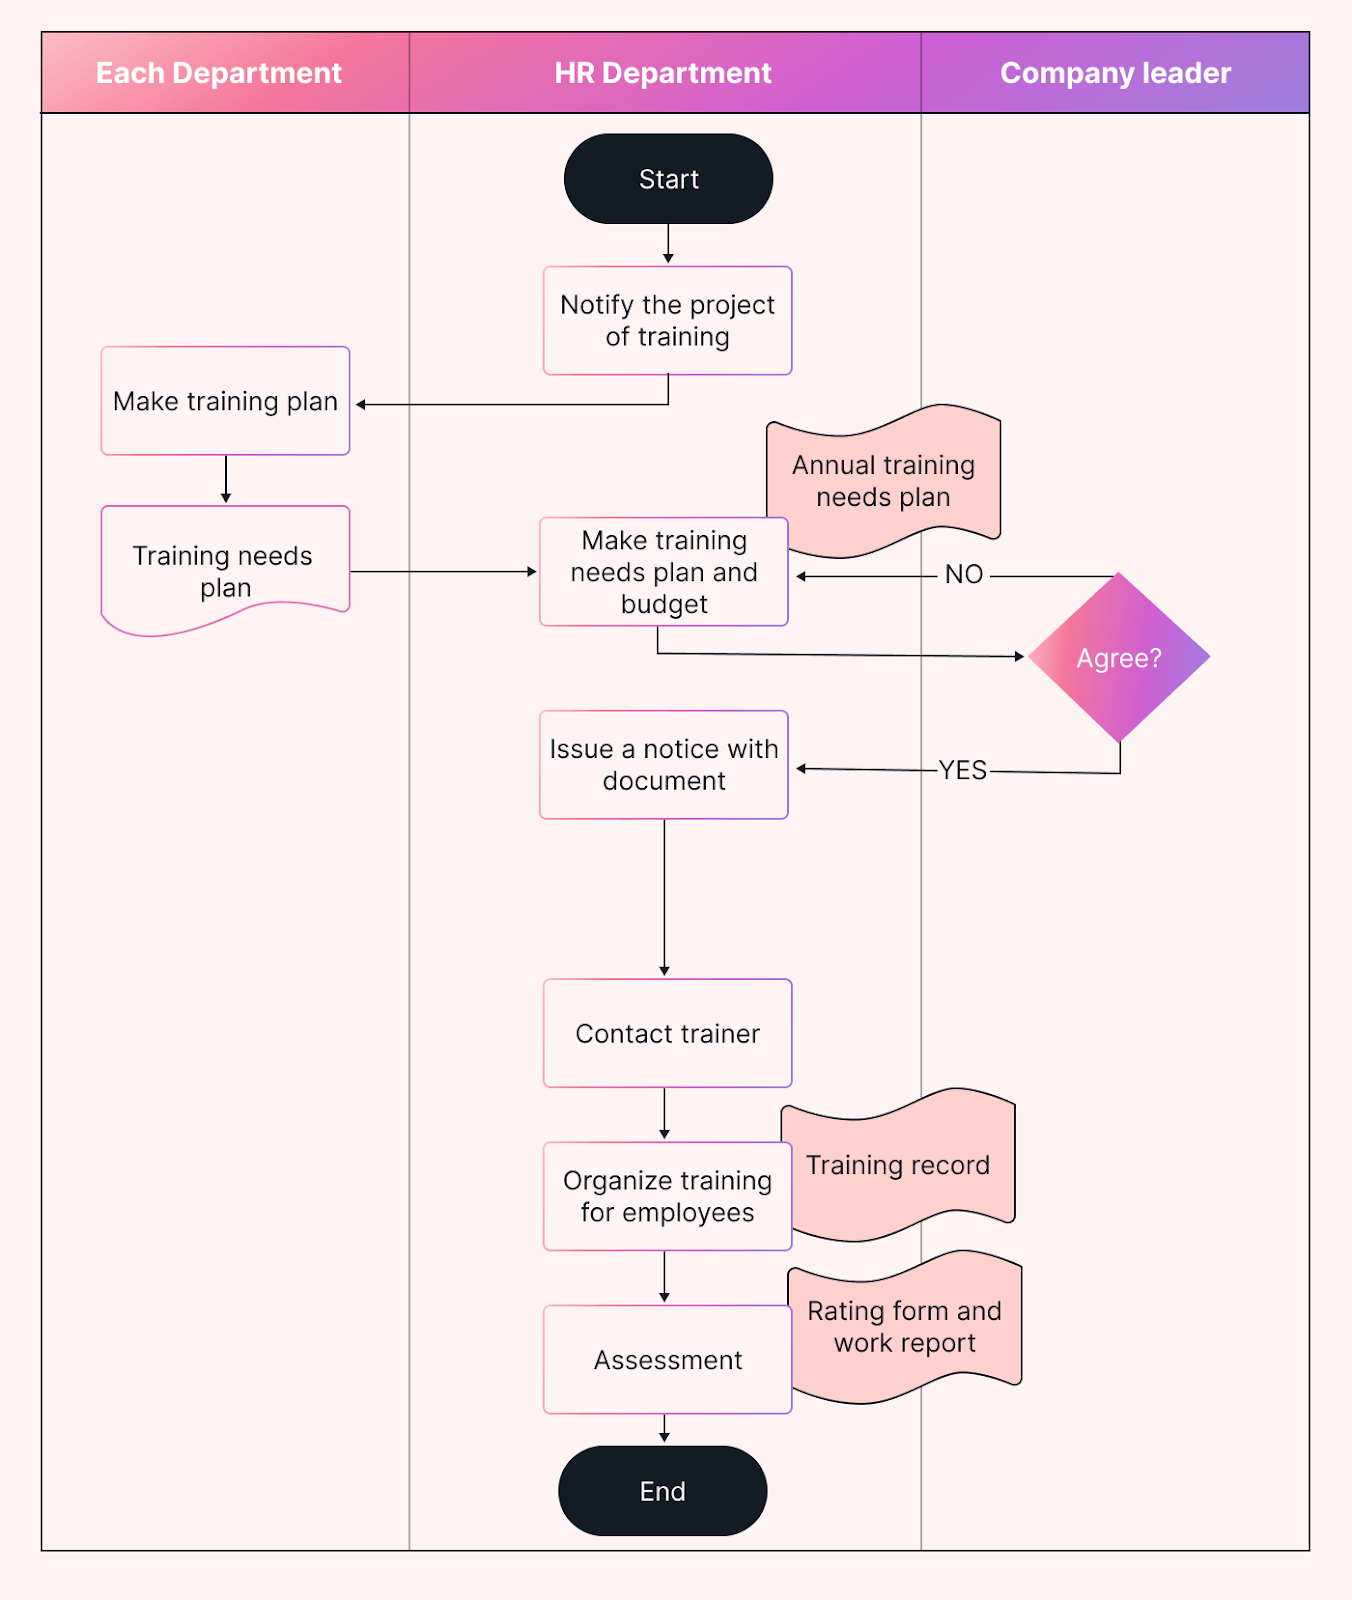
The swimlane diagram outlines a nine-step management workflow for employee training programs, beginning with an initiation "Start" label and ending with an "End" label.
To do this, we:
- Tell stakeholders
- Make a training plan
- Send notice and documents
- Contact trainer
- Organize training sessions
It also incorporates maintaining records of the sessions and assessing employees' performance through rating forms and work reports. This structured approach ensures that all aspects of the training program are systematically planned, executed, and documented.
3. SIPOC diagrams
The SIPOC Diagram is a process map tailored for those who crave more structure than a traditional flowchart offers. It stands for Suppliers, Inputs, Process, Outputs, and Customers. This diagram provides a high-level view of a process, capturing the five major components that drive it.
It's particularly useful in quality management and is prevalent in settings that apply Six Sigma or other data-driven methodologies.
Example: Here’s how all of this looks in customer support, for instance:
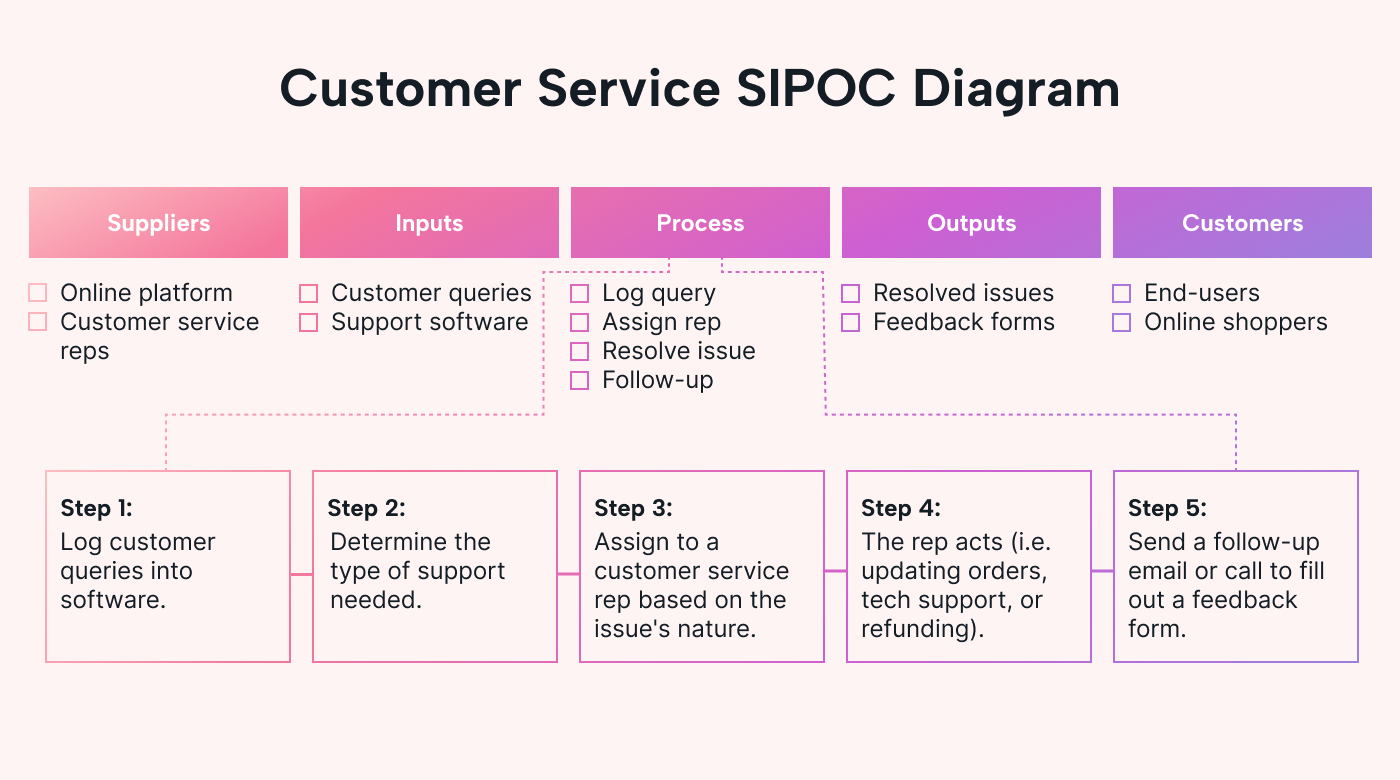 |
Using SIPOC diagrams for customer service is like a summary of what goes into resolving customer issues. This map is good for team briefings or for identifying potential areas of process improvement.
4. Value stream maps
The Value Stream Map is an overlooked type of process map. Value stream mapping provides a bird's-eye view of a process, from start to finish, while also showcasing the value-added and non-value-added activities.
So, what's the fuss about value-added and non-value-added activities? Value-added activities directly contribute to the end product or service, making them essential. Non-value-added activities are time and resource-wasting tasks that you should cut for more profit.
Example: Here’s how a value stream map for manufacturing phones looks:
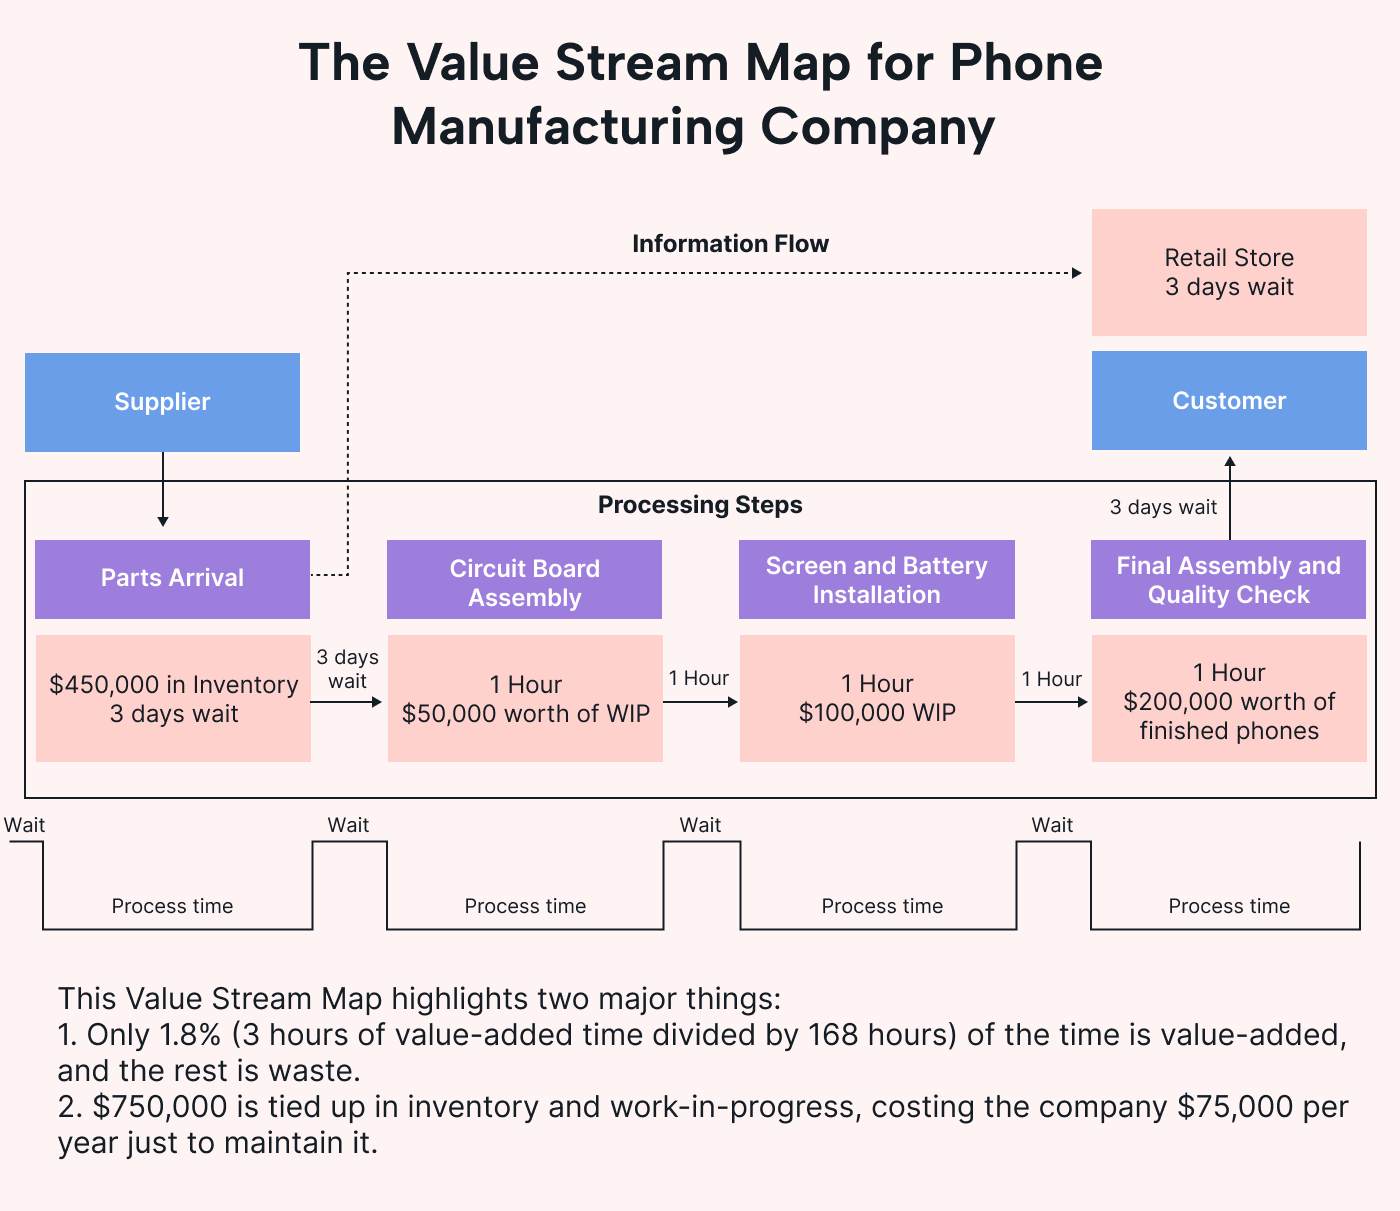 |
There are four non-value-added activities in this process:
- Inventory in warehouse: 3 days (72 hours) - $450,000
- Circuit board assembly: Waiting for the next step - $50,000
- Screen and battery installation: Waiting for the next step - $100,000
- Finished Goods: Waiting to be shipped - $200,000
Total wait time: 7 days (168 hours) - 3 hours (value-added time) = 165 hours.
The Value Stream Map reveals that only 1.8% of the time is value-added (process time), and the rest is wait time. It also shows that $750,000 is tied up in inventory and work-in-progress, costing the company $75,000 per year just to maintain it.
5. Process flow diagrams
If you find the basic flow charts too elementary, then process flow diagrams might be for you. They serve a similar purpose: to visually represent a process. But Process Flow Diagrams add a layer of complexity. They not only depict the steps involved, but also highlight the inputs, outputs, and resources each step requires.
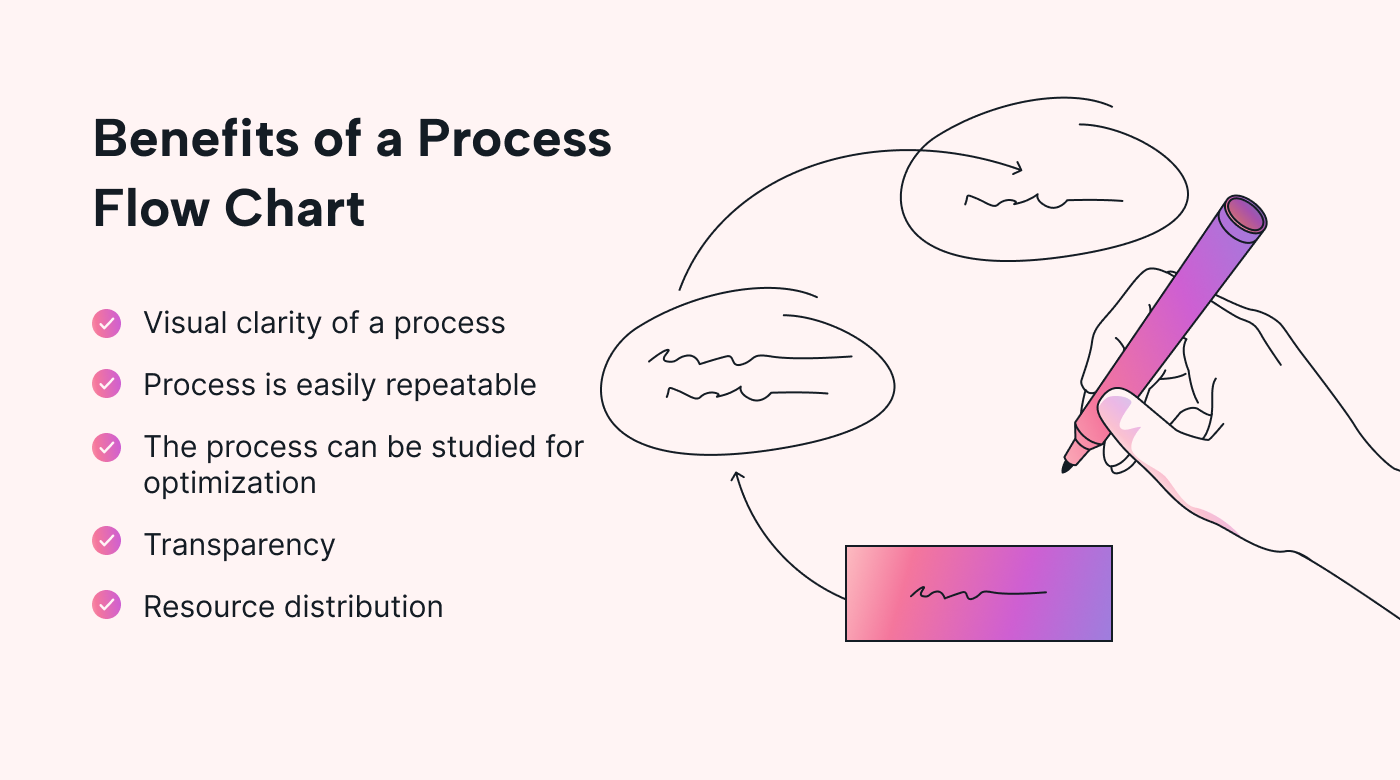
There are quite a few advantages to using process flow diagrams compared to regular flowcharts:
Example: Here's a process flow diagram for a car sales process:
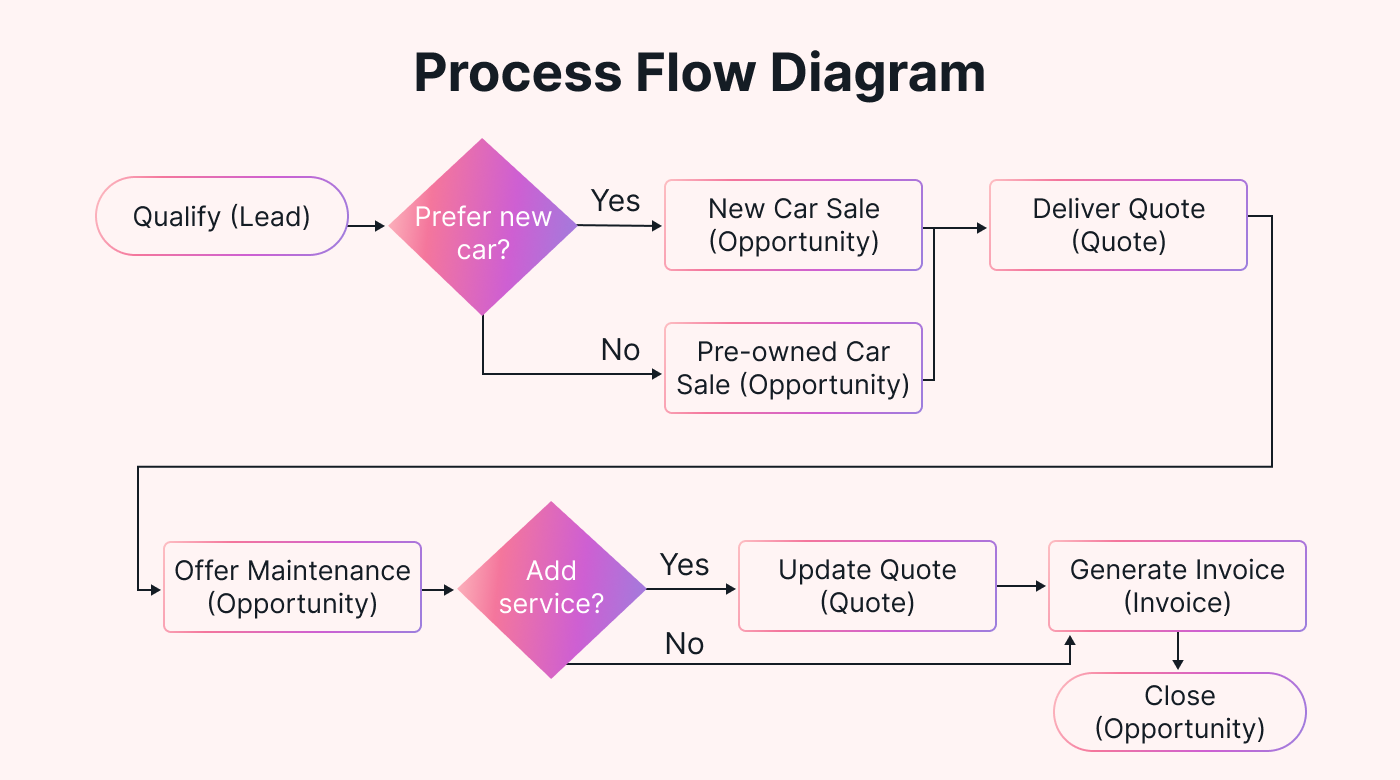
The process documentation begins by qualifying a lead to identify potential customers. From there, a decision point asks if the customer prefers a new car.
If the answer is "Yes," the process leads to a new car sale, and a quote is delivered to the customer. If the answer is "No," the process shifts to selling a pre-owned car, followed by an opportunity to make that sale.
An additional stage at the end asks whether to "Add Service," offering another option within the process.
6. BPMN diagrams
Business Process Model and Notation (BPMN) is the high-definition equivalent of process mapping. If you're already a fan of flowcharts, BPMN diagrams will make you feel right at home, but with even more details.
There are three main elements you need to know about BPMN:
Flow Objects: These include events (circles), activities (rounded rectangles), and gateways (diamonds).
Connecting Objects: We're talking about sequence flow (solid lines), message flow (dashed lines), and associations (dotted lines).
Swimlanes and Artifacts: These help to organize activities into different categories.
Think of these elements as Lego blocks for your BPMN. You can combine them in many ways, but always keep the structure. For instance, a sequence flow can't connect two events directly.
Example: Let’s imagine a BPMN diagram detailing an online shopping process:
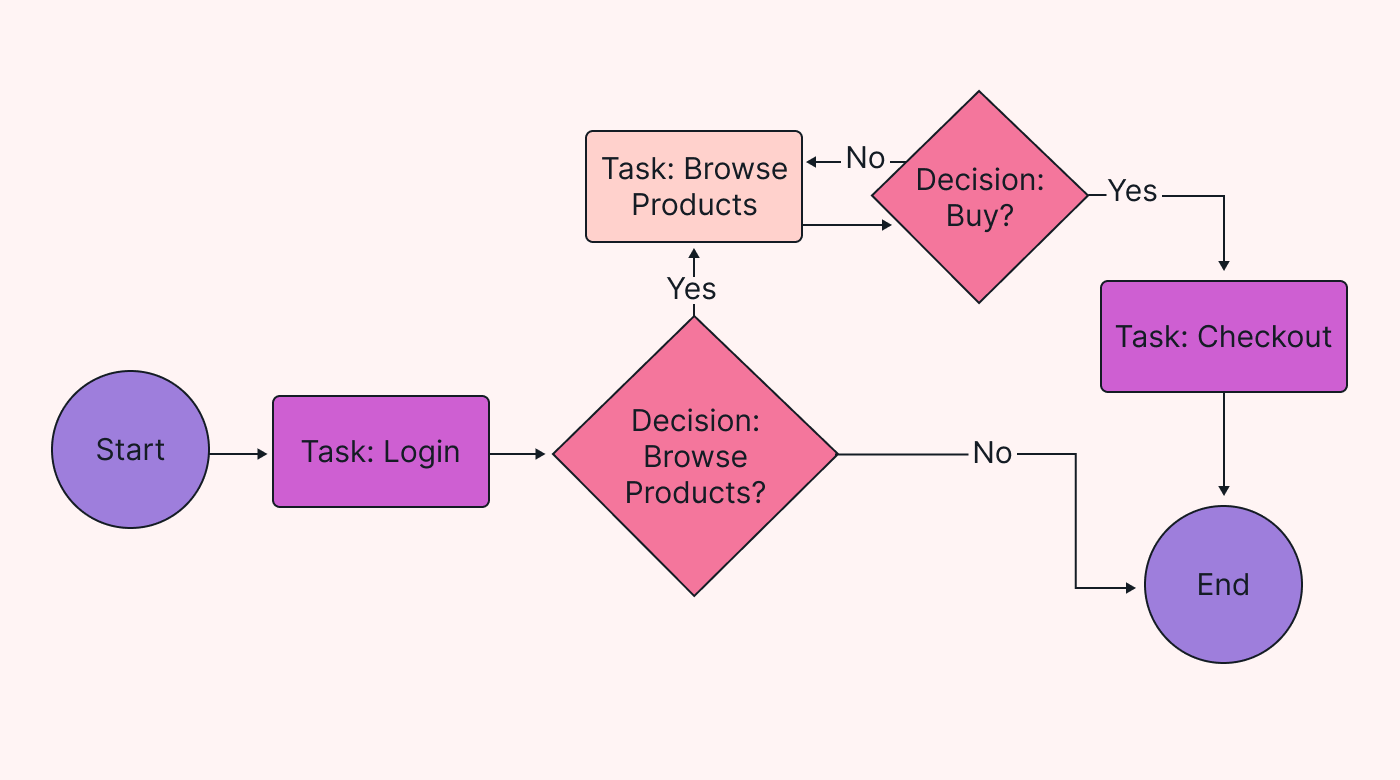 |
- Start Event: The user logs into the account.
- Task: The user browses products.
- Decision Gateway: Does the user want to buy a product?
- Sequence Flow: Connects the tasks and decision points.
The easiest way to create a process map
Here are the easiest steps you need to take to create your process map.
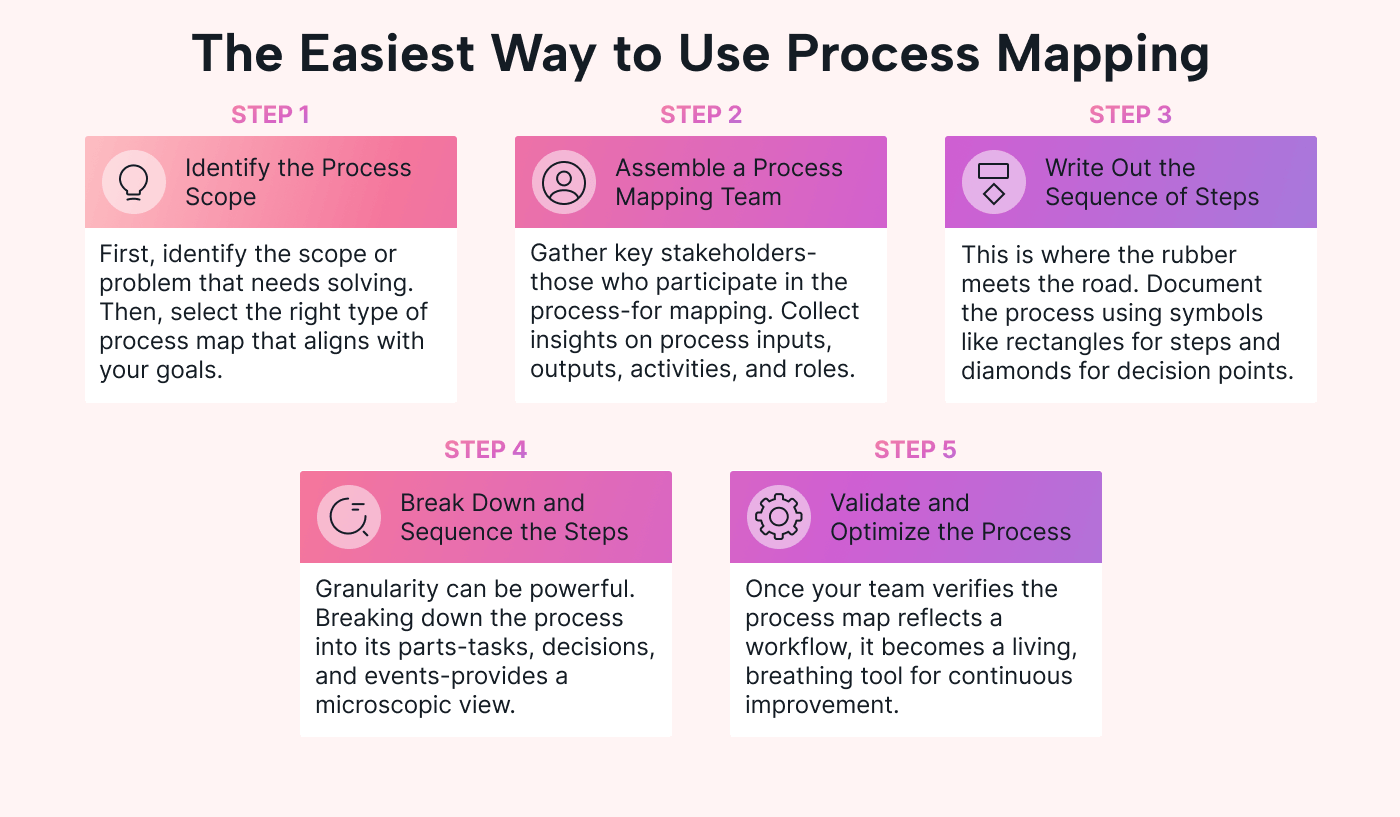 |
Step 1: Identify the process scope
So, you've decided to roll up your sleeves and map out your process. But where do you start? First, identify the scope or problem that needs solving. Select the right type of process map that aligns with your goals — a process flowchart, SIPOC diagram, or another workflow diagram.
For example, if you're a Scrum master struggling with Sprint planning, a basic flowchart might suffice. It could outline the process from backlog grooming to the end of the sprint review.
Step 2: Assemble a process mapping team
Mapping isn't a one-person job. Gather key stakeholders — the folks who actually partake in the process. Collect insights on process inputs, outputs, activities, and roles. This collaborative effort ensures you're covering all the bases.
Step 3: Write out the sequence of steps
This is where the rubber meets the road. Identify the start and end points of your process. Document the flow using common symbols like rectangles for steps and diamonds for decision points. It's not just about looking good on paper. It's about clarity and operational efficiency.
Step 4: Break down and sequence the steps
Don't underestimate the power of granularity. Breaking down the process into its individual components — a series of tasks, decisions, and events — offers a microscopic view. But remember, micro doesn't mean myopic. Arrange these steps in a sequential order and assign them to specific roles or departments.
Why? Because a well-sequenced process enables smoother transitions and reduces the chances of bottlenecks or delays. Efficiency is the name of the game here.
Step 5: Validate and optimize the process
Almost there! Once your team verifies that the process map accurately reflects the workflow, it's not just a fancy diagram.
It's a living, breathing tool for continuous improvement. Collect feedback to identify bottlenecks and inefficient steps. Optimize, iterate, and strive for process excellence.
Simplify your process mapping with Motion
Now that you know the intricacies of process mapping techniques, let's talk about making it even more seamless and efficient with Motion’s AI-powered productivity hub.
A big advantage of Motion’s Intelligent Calendar and Task Manager is that it automates the planning and prioritization of tasks. The app integrates your tasks, projects, meetings, and process mapping docs, offering a single, optimized schedule so you can focus on what matters.
For team settings, the value amplifies.
Motion ensures everyone knows their role and priority, aligning individual productivity with team goals. This eliminates bottlenecks often associated with traditional process mapping approaches.
It gives you visibility that removes the need for frequent check-ins, enabling your team to focus on actual work rather than constant planning.
You can try Motion for free here.


