Business processes are key pieces of the business management puzzle. Without them, business actions aren't repeatable and are challenging to track. Having processes helps your company succeed (and your bottom line).
But how can you show what goes into an entire process, what's produced, and who benefits?
With a SIPOC diagram, of course.
In this guide, you'll learn about the SIPOC diagram, its benefits, and how to create (and use) a SIPOC diagram for your business.
What is a SIPOC diagram?
SIPOC diagrams are high-level process maps of sorts that define key pieces of a process, its outputs, and the customers who consume the outputs.
SIPOC diagrams originated as a part of Six Sigma, a quality management methodology that aims to improve quality and reduce errors in processes, products, or services.
SIPOC diagrams are an excellent, high-level overview of processes. They help you visualize the important aspects of a process so that you can understand (or troubleshoot) the process.
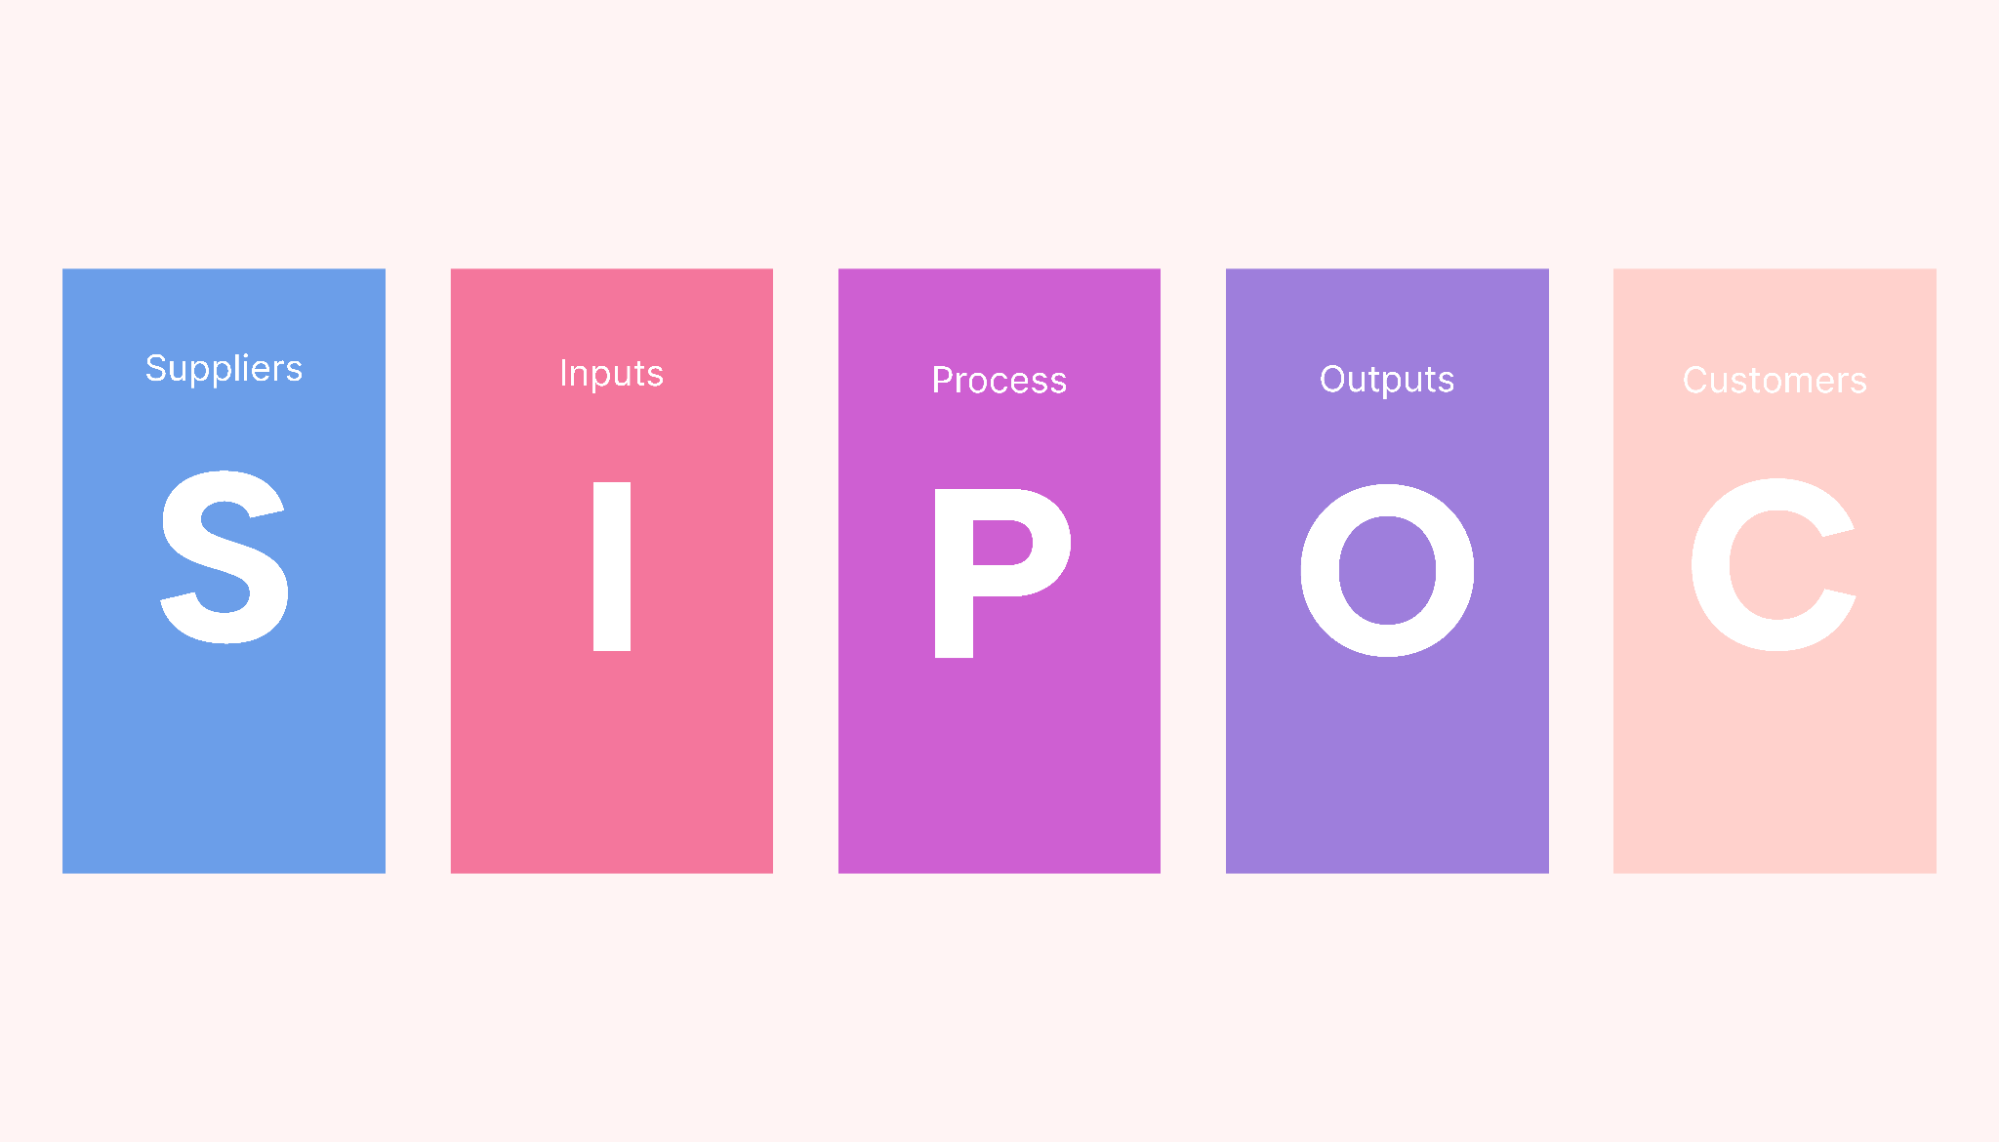
SIPOC stands for:
- Supplier
- Input
- Process
- Output
- Customer
Here’s an example of how SIPOC can help any type of business.
A busy restaurant having trouble with their delivery process. With a SIPOC diagram, they deduce that the main issue is slow order fulfillment, resulting in customer complaints. With the SIPOC analysis, the restaurant team visualizes key steps of the process and identifies the bottlenecks that need streamlining.
How does a SIPOC diagram work?
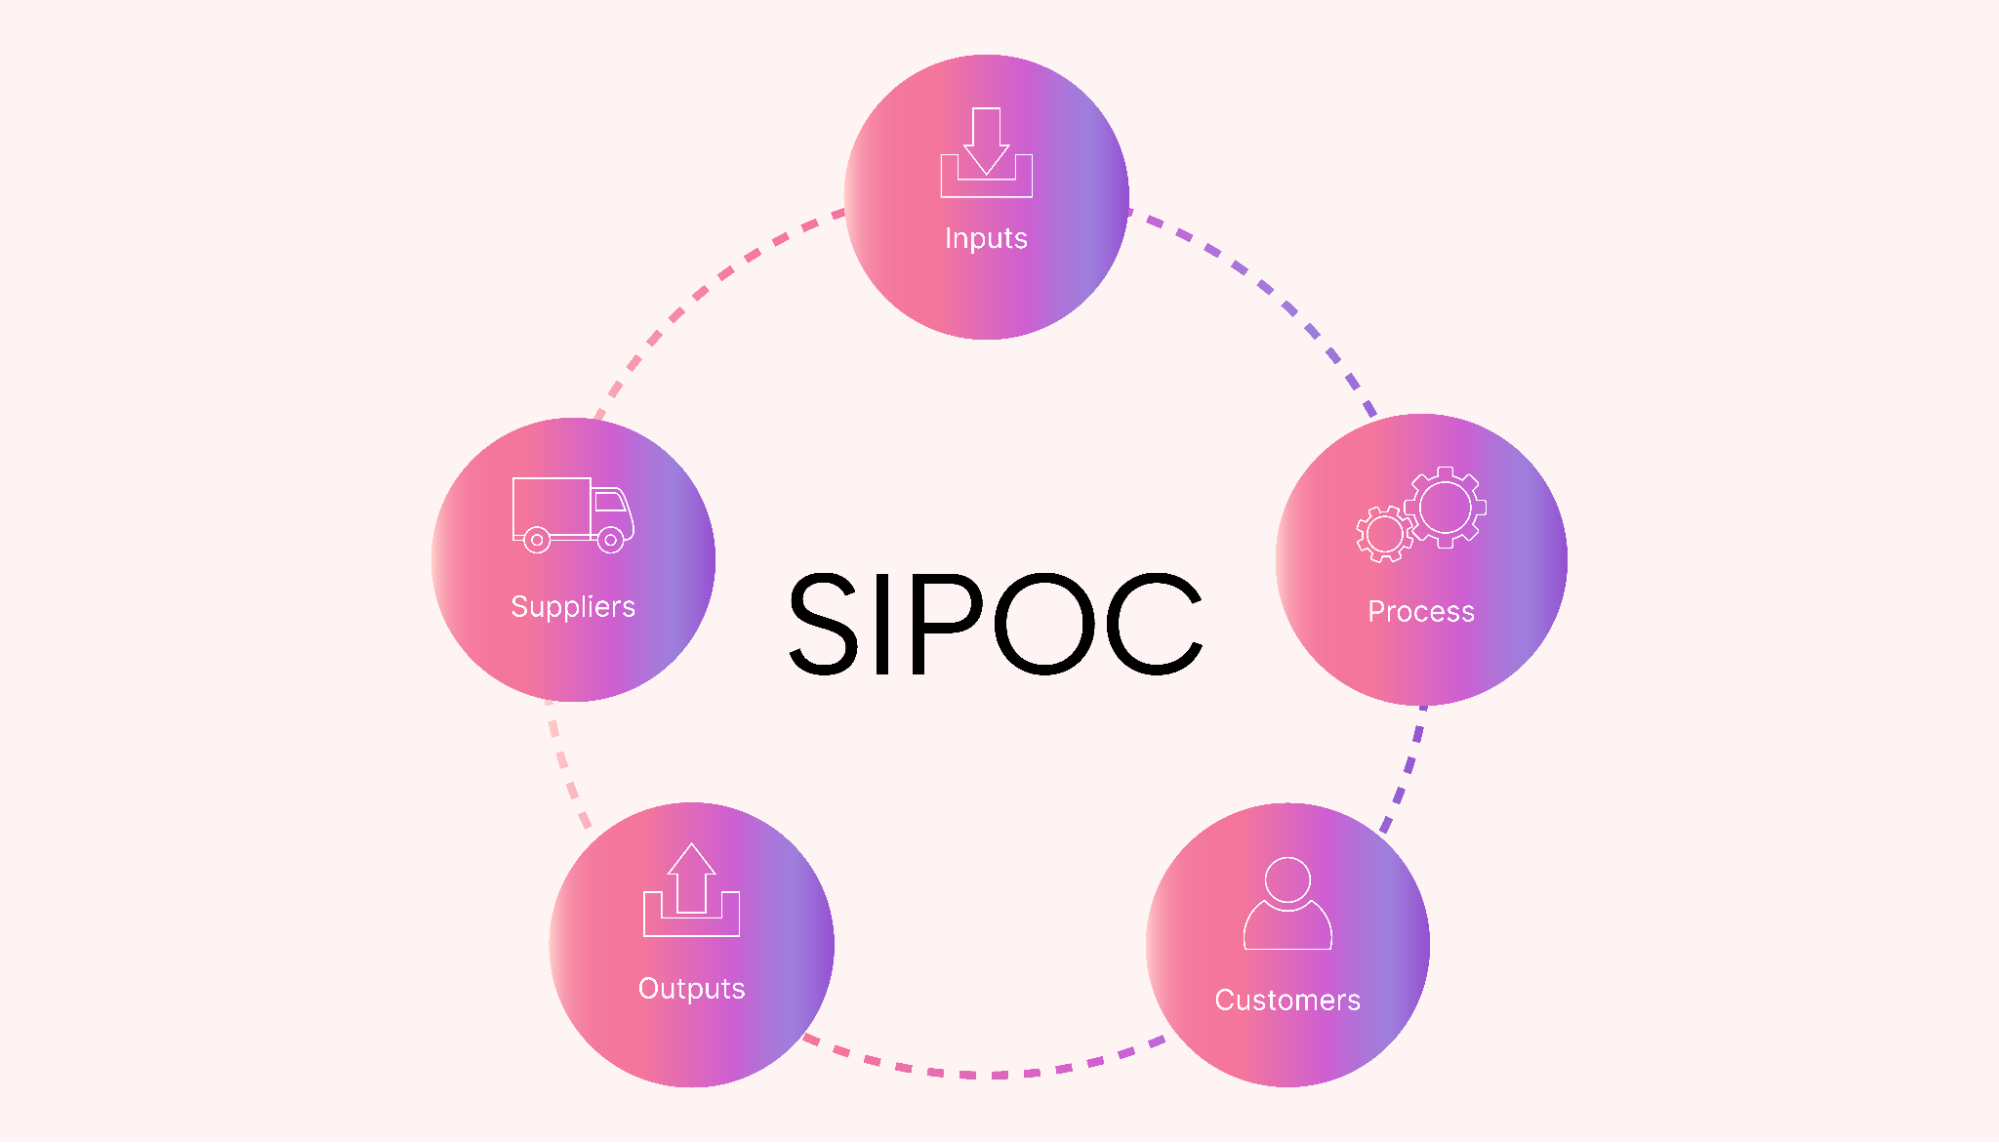
The SIPOC diagram works by visually breaking down a process into these five components:
- Supplier: External sources that provide inputs to the process. These could be individuals, departments, or external organizations that contribute to your process.
- Input: Materials, information, or resources the suppliers provide and use as inputs for the process. These are the raw materials or data that the process operates on.
- Process: The high-level steps that transform the inputs into outputs.
- Output: The resulting products or services that the process generates. These are the tangible outcomes that customers or downstream processes consume.
- Customers: The end-users or recipients of the process outputs. These could be internal or external customers.
By analyzing these components, the SIPOC diagram can help you understand what's lacking or needs improvement in your process.
 |
The SIPOC is a simple high-level view of your processes that can achieve big things for your business.
Why use a SIPOC diagram?
Here are a few important reasons you should be using SIPOC diagrams (including examples).
Understand what makes a process valuable
By visually mapping a SIPOC diagram, you'll not only gain insight into how the elements of a business process relate to each other but also find opportunities to optimize those processes.
A coffee company might use a SIPOC diagram to analyze its coffee roasting process. They identify that the ratio of time and temperature are critical inputs toward coffee quality.
Understand what affects scope (and how)
Not only will you understand how the different elements of a process relate to one another, you'll also see how those elements relate to the scope (or boundaries) of the work.
A dropshipping company might use a SIPOC diagram to visualize how the different elements of a SIPOC relate to the scope of their order fulfillment process. Understanding this will help them manage the workflow while still meeting customer expectations.
Understand what is valuable to the customer
Most importantly, the SIPOC diagram establishes a direct value connection between your product or service and your customers.
An electronic device company might use a SIPOC diagram to align product design to customer expectations (and experience). By visualizing how design choices impact user satisfaction, they can consistently deliver products that resonate with their customer base.
Clarity
Finally, a SIPOC diagram is a perfect tool to convey the value of the pieces that power a process so that your entire team (and stakeholders) are on the same page for all future decisions.
A manufacturing plan might use a SIPOC diagram during product development to align the engineering team not only on the product design but the business “why” behind the design.
When to use a SIPOC diagram
In the Six Sigma methodology, SIPOC diagrams are typically implemented during the "define" stage of the DMAIC framework, but a SIPOC is effective (and valuable) at any stage of a process. Here are some examples:
- To visualize the pieces of existing processes when there's a problem.
- For process documentation.
- To conceptualize the pieces (and value) of new processes
- For continuous process improvement
 |
How to make a SIPOC diagram
Although the SIPOC is a Six Sigma tool, the beauty is that you can use SIPOC without knowing much about Six Sigma.
To explain the steps of creating a SIPOC diagram and how to use it, we'll use a fictional web design company as an example. The business is defining its web design processes so they are repeatable for every new client. For this example, let’s say they are dissecting the process for a new e-commerce website.
By the way, in Six Sigma, it’s suggested that, instead of following the acronym in order, you begin with the process and work your way out in this order: Process, Outputs, Customers, Inputs, and Suppliers.
Why?
Because the process is the foundation of the diagram, and by starting with it, you can easily build out the rest. That said, visually, the SIPOC diagram looks and works best in the SIPOC order.
Before starting:
- Have a piece of paper ready or open a new spreadsheet.
- Create five columns (and leave spaces for the header).
- Know that lists can get long when you analyze all the angles.
- Take advantage of this analysis to see what you're missing or what you have but don't need.
Step 1: Process
The first step is to identify the process and define its boundaries.
Although high-level, this piece should clearly show what it takes to go through the process from beginning to end.
In the third column, right in the center, add the heading for Process. Each cell below will be the process progressing from top to bottom.
The process for the web design company has these steps:
- Talk to the client
- Design the website layout
- Get client approval
- Code the website according to the approved design
- Get client approval
- Test the website functionality
- Finalize and optimize
- Deliver the finished website to the client
- Follow up on customer satisfaction
Step 2: Outputs
The second step is to define the outputs and results of the defined process.
This section helps you define what customers can buy from you in the context of the entire production process
In the case of the web company, these are the outputs:
- UX/UI design
- Responsive Web/mobile website and applications
- E-commerce solutions
- Web hosting packages
- Maintenance and support
Step 3: Customers
The third step is to list all the customers or users of the outputs, be they internal or external. This section allows you to narrow down and define your true customers.
Here's what our make-believe web design agency has on their list for e-commerce websites:
External customers
- Business owners
- Startups and entrepreneurs
- E-commerce businesses
- Digital marketing agencies
- Existing website owners
- Retailers
Internal customers
- Key stakeholders (company owners and investors)
- Project team members
- Accounting
Step 4: Inputs
The fourth step is to define the inputs necessary to complete the process. These can be materials, human resources, technology, machinery and information.
Here's what our fictional web design firm has:
- Web designers and developers
- Graphic designers
- QA testers
- Sales team
- Admin staff
- Computers and laptops
- Design software
- Development tools
- Testing devices
- Project management and communication tools
- Office facilities
- High-Speed internet
- Data storage
Step 5: Suppliers
Finally, define the suppliers that provide the inputs for the process, both internal and external.
These are the suppliers for our example:
- Web hosting providers
- Domain name registrars
- Stock photo and media libraries
- SEO services
- Hardware suppliers
- Software and tool providers
- Payment processing services
- Cloud service providers
- Landlord
Create your SIPOC diagram today
Trying to follow unclear business processes is hard, but it's painful without a SIPOC diagram. With a SIPOC diagram visual tool, there's no guesswork or space for doubts; all the basics are laid out, and the process is transparent.
You, too, can use the SIPOC to visualize any process in your business with a SIPOC map. Doing so will give you valuable insight into the essential components of the process. It'll also help all relevant stakeholders understand the process.
Add your SIPOC diagrams to Motion, ready to be referenced and collaborated on directly in the app.


