In business, effective decision-making is key to success.
Easy decisions, such as “Should we buy a new espresso machine for the cafeteria?” usually require just a quick “yes” or “no” from the boss or manager.
But many decisions need serious discussion — and some are so complex that the variables should be mapped out in detail to arrive at the right conclusion.
Hiring more people or maintaining the status quo? Launching a new product line or giving the existing assortment a facelift? Purchasing HR technology or outsourcing HR to a third party?
It’s these complex, impactful decisions that benefit most from something called a decision tree — a diagramming and analytics tool that captures all the potential ramifications of a decision.
This article explains what decision tree analysis is and walks you through the process so that you can start using this tool right away.
What is decision tree analysis?
A decision tree is a visual guide for decision-making.
Imagine a tree where each branch represents a different choice or path you can take. Considering the potential outcomes and risks for these options — in other words, analyzing the possibilities shown in the decision tree — helps you determine the best decision to make.
The decision tree method stems from the field of decision theory and operations research that began in the mid-20th century. By visually mapping out the possible consequences of different actions, including uncertain outcomes from chance events, you can easily select the most reasonable path forward in a complex problem-solving situation.
Decision tree analysis is often used by project managers and other decision-makers in business planning. Complex versions are used in medical diagnoses and machine learning algorithms. Here, we’ll look at how to apply the decision tree to business-related decisions.
What does a decision tree look like?
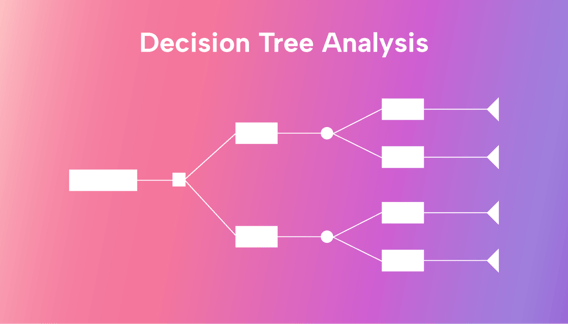
The classic decision tree looks like a tree on its side, with the roots (the decision to be made) on the left and the branches (the options and trajectories to make the decision) stretched out to the right.
 |
Decision tree symbols
A decision tree uses specific symbols that show the types of actions at each point in the decision-making process. Let’s review these before diving into how to use this tool.
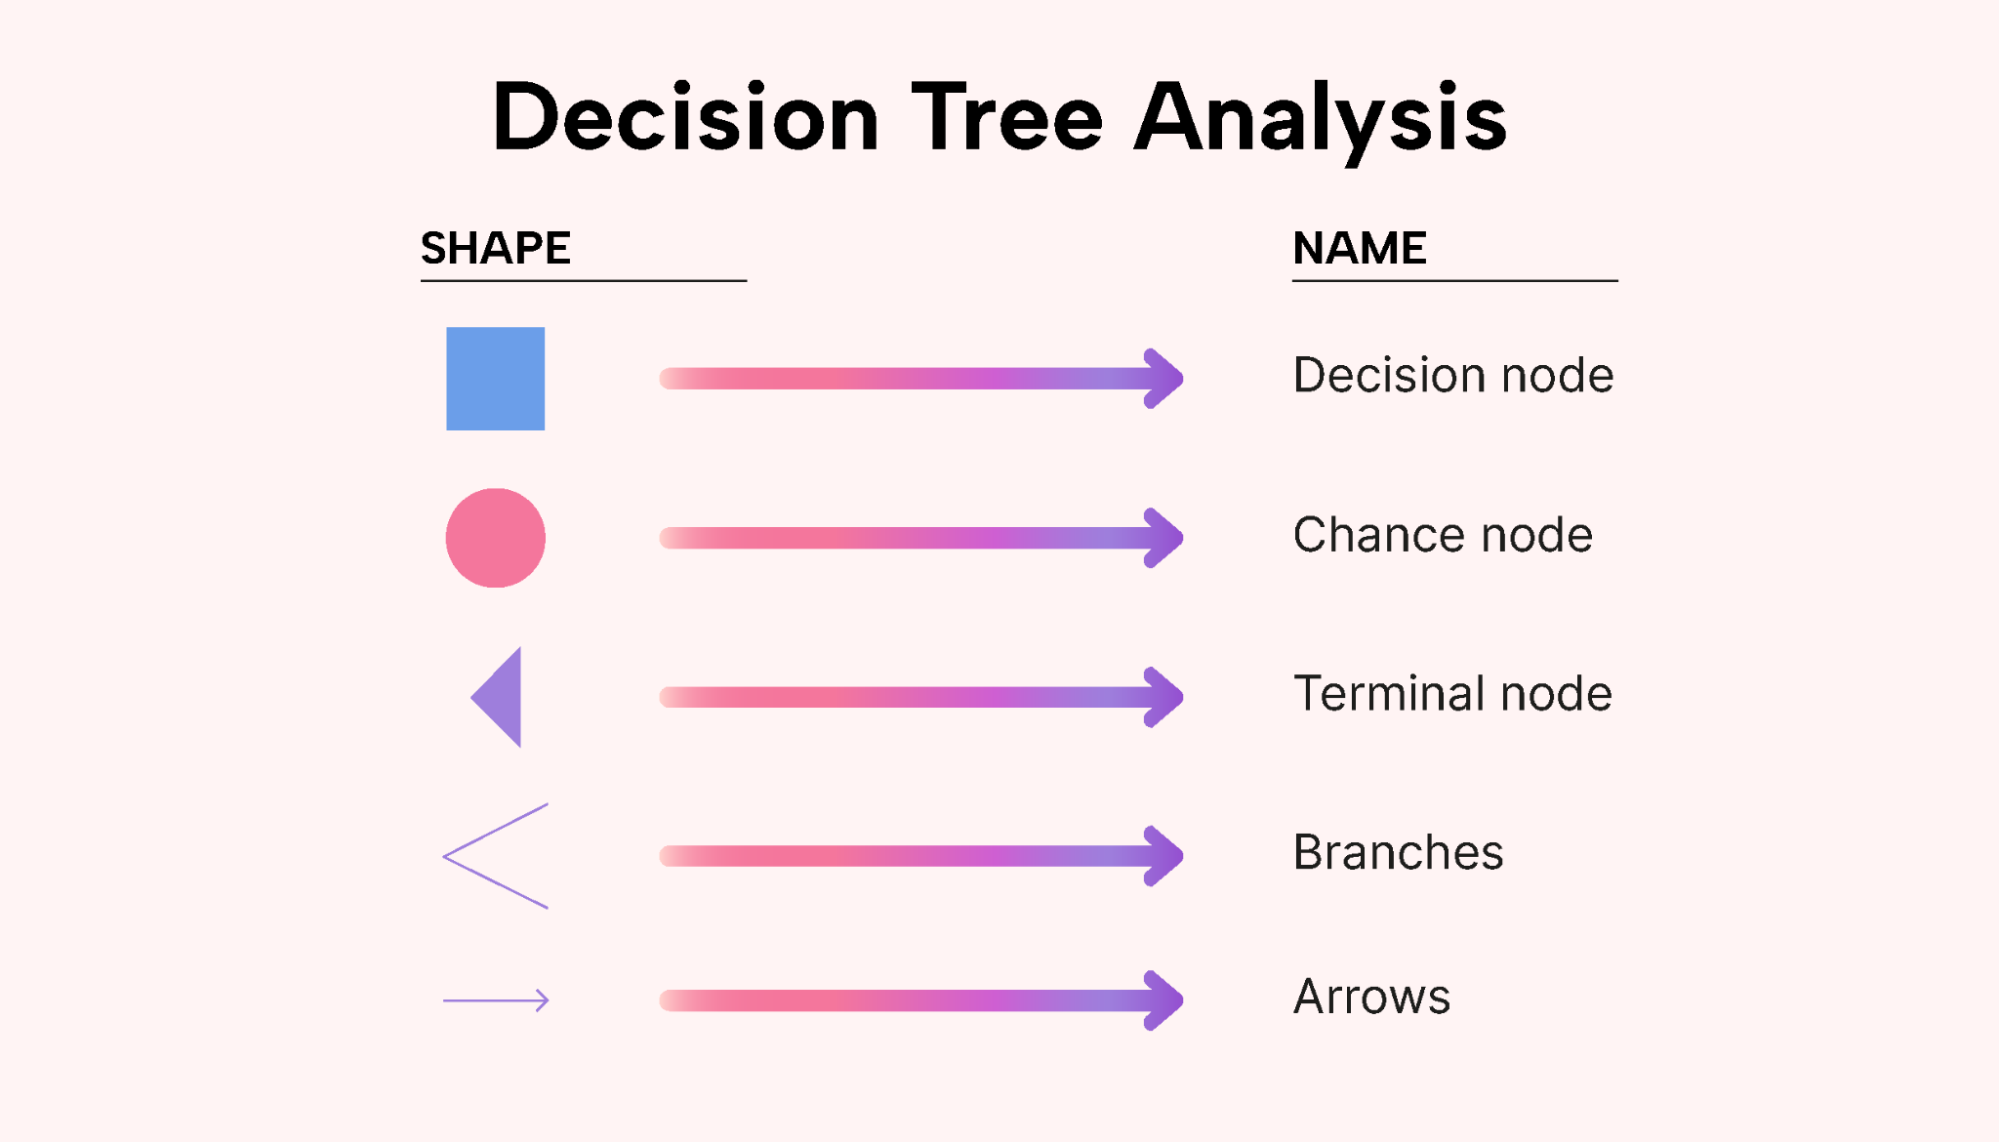 |
Decision node: Usually represented by a square or rectangle, this symbol indicates a point where a decision must be made.
Chance node: Often depicted by a circle or oval, this symbol represents a point where various outcomes may occur, usually with associated probabilities.
Terminal (or end) node: Typically shown as a triangle or oval, this symbol marks the end of a particular path within the tree and often indicates the final outcome or payoff of a decision path.
Branches: These are the lines that connect the nodes. They represent the different choices or paths that can be taken from a decision node or the possible outcomes from a chance node.
Arrows: Sometimes used to indicate the direction of the flow within the tree, these symbols show the progression from the decision nodes through the chance nodes to the terminal nodes.
Annotations: While not symbols, annotations such as text, numbers, or labels are used to provide additional information on the nodes and branches. These can include details like the specific courses of action, probability, cost, or payoff associated with a particular element of the tree.
What is the difference between a decision tree and a flowchart?
A decision tree has some similarities with a flow chart. Though they may look similar, they have different purposes:
Decision tree
A decision tree is used to help make decisions. It shows different choices, outcomes, and risks, and it usually involves probabilities and calculations to determine the best path to take. It helps you analyze and weigh different options to arrive at a decision.
Flowchart
A flowchart is a diagram that shows a process or workflow. It outlines the step-by-step sequence of actions needed to complete a task, including the decisions that must be made along the way. However, it doesn’t usually involve weighing risks or calculating probabilities.
So, simply put, a decision tree is a guide for making a choice among various options, while a flowchart is a map for following a process or completing a task.
How to perform a decision tree analysis
Let’s walk through the decision tree analysis process step-by-step so that you can get a good feel for how this tool works.
We’ll use the example of the owner of a specialty clothing store who needs to decide whether to hire extra store help for the coming business year.
The hiring options and costs the business owner is pondering are as follows:
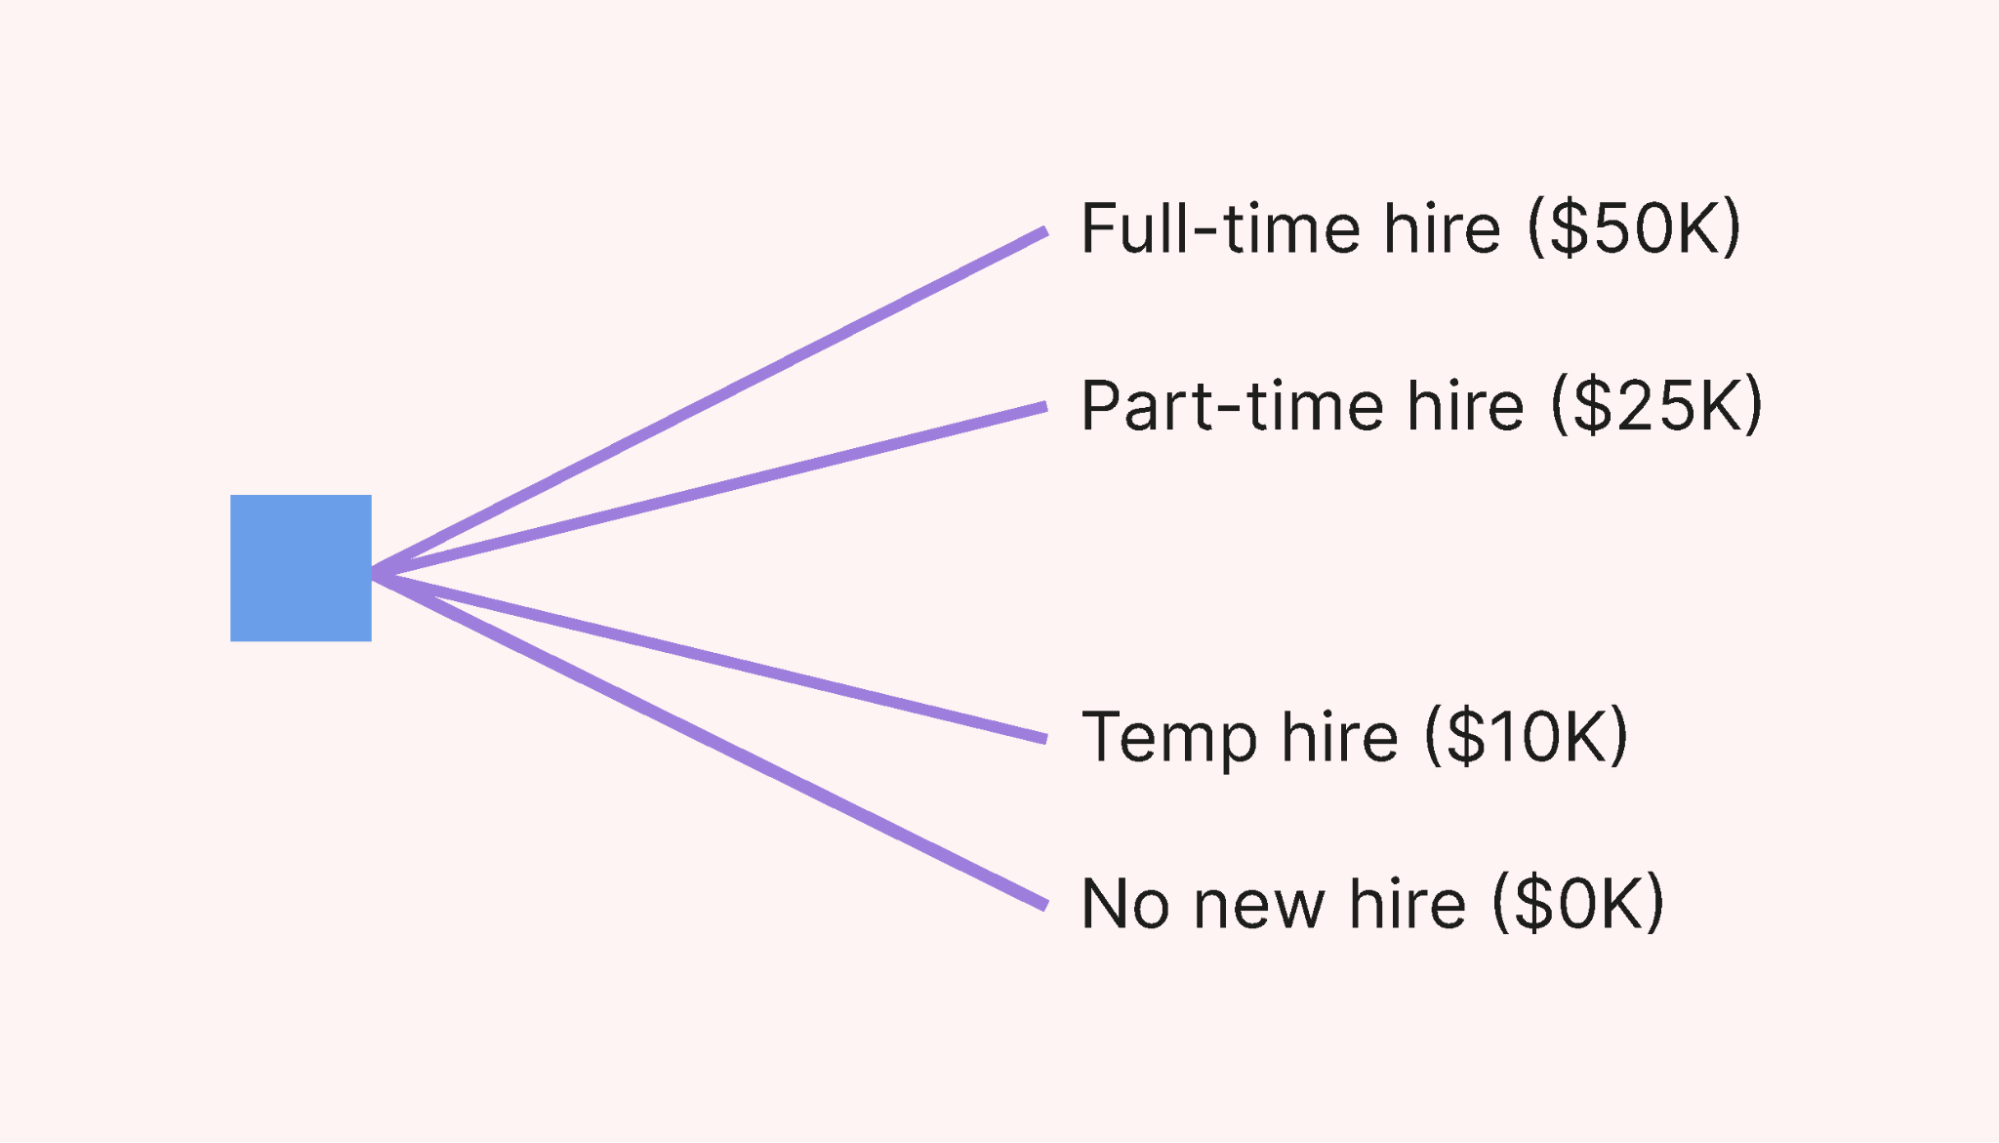
- Hiring a full-time person ($50K)
- Hiring a part-time person ($25K)
- Hiring temp help during anticipated peak times ($10K)
- Not hiring anyone ($0K)
Each of these choices will impact the bottom line differently. The question is, which one will offer the best revenue potential — and at the lowest risk?
Step 1: Map out the main options
Begin your decision tree analysis by clearly defining the decision to be made and the options you are considering.
To visually map this out, take a piece of paper and draw the decision node on the left-hand side in the form of a small square or rectangle.
From the decision node, draw the decision branches for the options, and write a brief description of each option along them.
Here’s what this would look like for the clothing store owner:
 |
Step 2: Add the chance nodes
Now, do an inventory of the uncertainties you may face as you try to make this decision.
For instance, a major uncertainty in business is how steady or volatile the market for your product will be.
Examples of other uncertainties include the following:
- The potential effects of your competition launching a new or better product
- New trends or fads that redirect consumer spending
- A breakthrough in scientific research that’s beneficial for your product or service
- The possibility of a natural disaster, such as a hurricane or wildfire, occurring near your physical location
- Supply line disruptions due, for instance, to national or international conflicts
- Difficulty attracting the skilled workers you need
- A pandemic, with the potential of lockdowns and store closings
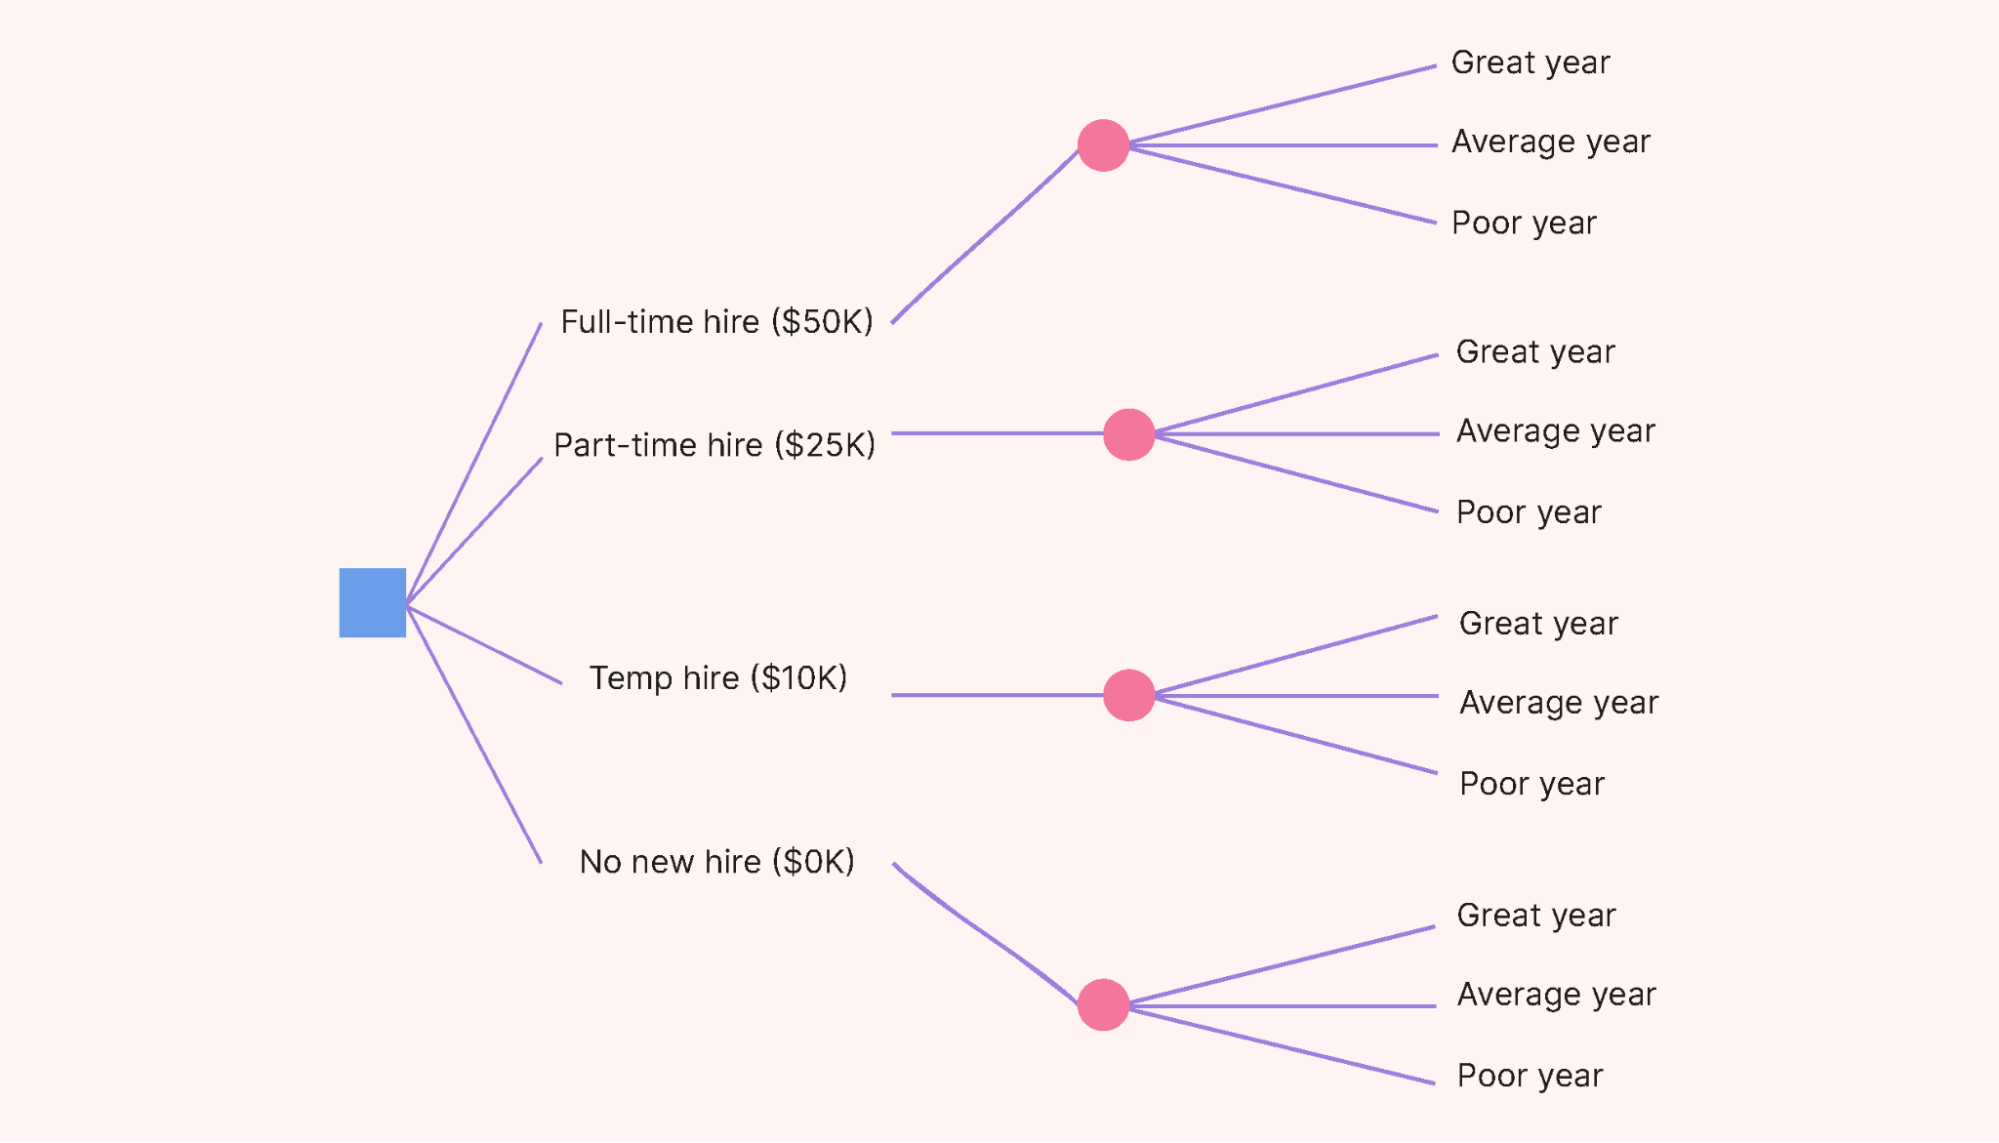
Once you are clear on what the main “chance” triggers or filters for the decision could be, capture these in some brief statements.
For instance, let’s say our specialty clothing store is located in a tourist town, and a significant portion of its annual revenue depends on seasonal sales.
The tourist revenue tends to fluctuate due to external factors, such as weather, inflation, and foreign tourists’ ability to enter the country. Based on these factors, there are historically three main possibilities for this store. It could have:
- A great year
- An average year
- A poor year
We’ll insert these possibilities as the chance nodes in our decision tree diagram.
 |
Step 3: Calculate the monetary value of each choice
Next, determine the monetary value or outcome of each choice. This is the end node or end point of each branch, marked with a triangle.
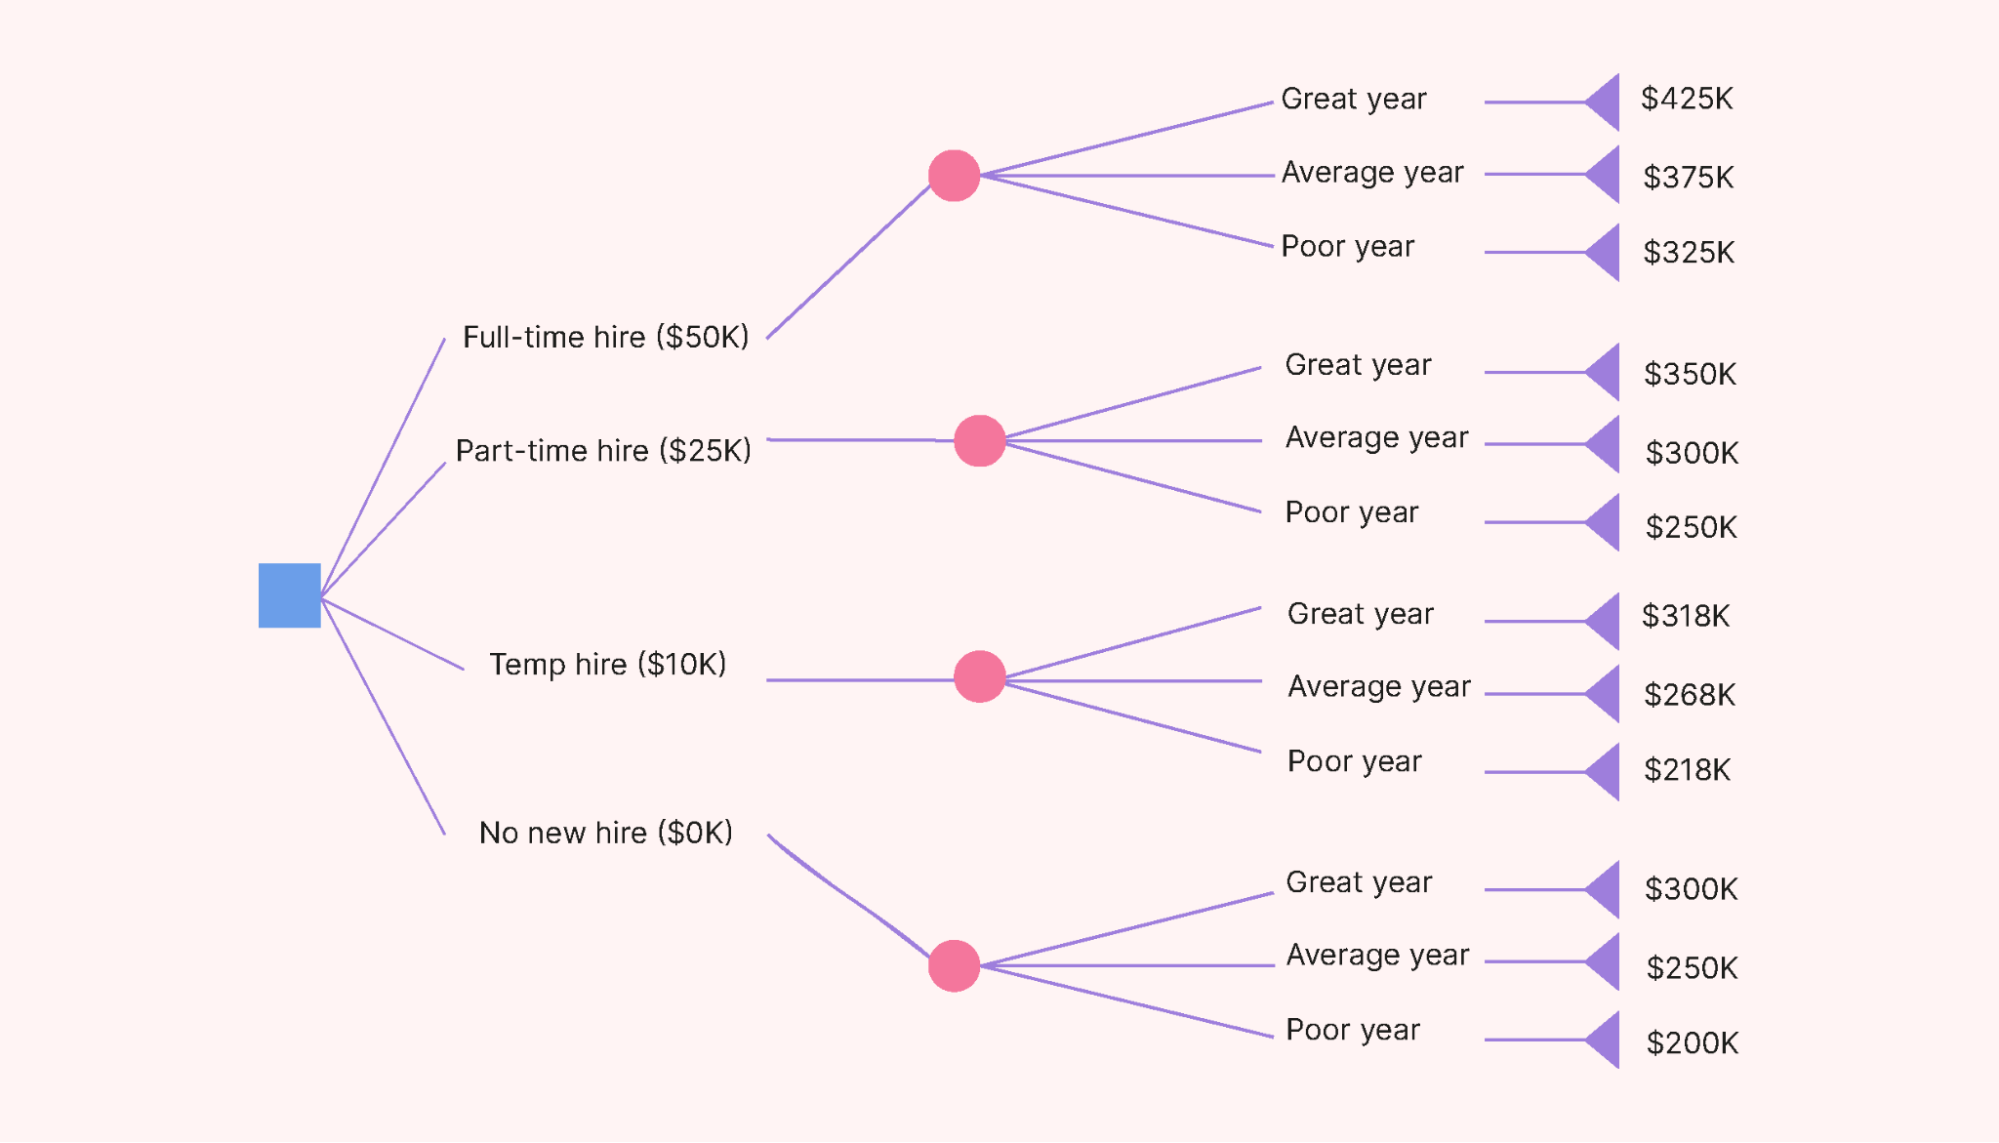
In the clothing store example, let’s say that, in an average year, the store brings in $250K in revenue. In a great year, this amount increases to $300K, and in a poor year, it drops to $200K.
This is the baseline value — the status quo if the owner doesn’t hire any new employees that year.
The owner is familiar with employee return-on-investment (ROI) figures for the store:
- Full-time employees generate 250% of their salary cost.
- Part-time employees generate 200% of their salary cost.
- Temp employees generate 180% of their salary cost.
This produces the following results:
- Hiring a full-time person at $50K potentially brings in $125K in extra revenue.
- Hiring a part-time person at $25K brings in $50K in extra revenue.
- Hiring temp help at $10K brings in $18K in extra revenue.
We now have enough information to calculate the end node values, shown in the next image. The extra revenue amounts per new employee type are added to the baseline figures shown in the “no new hire” section.
 |
Step 4: Analyze the results shown in your decision tree
Now, we’ve come to the analysis component of the decision tree method.
First, we’ll calculate the actual costs of the choices we can make. Let’s do this by subtracting the additional salary cost from the potential revenue as follows:
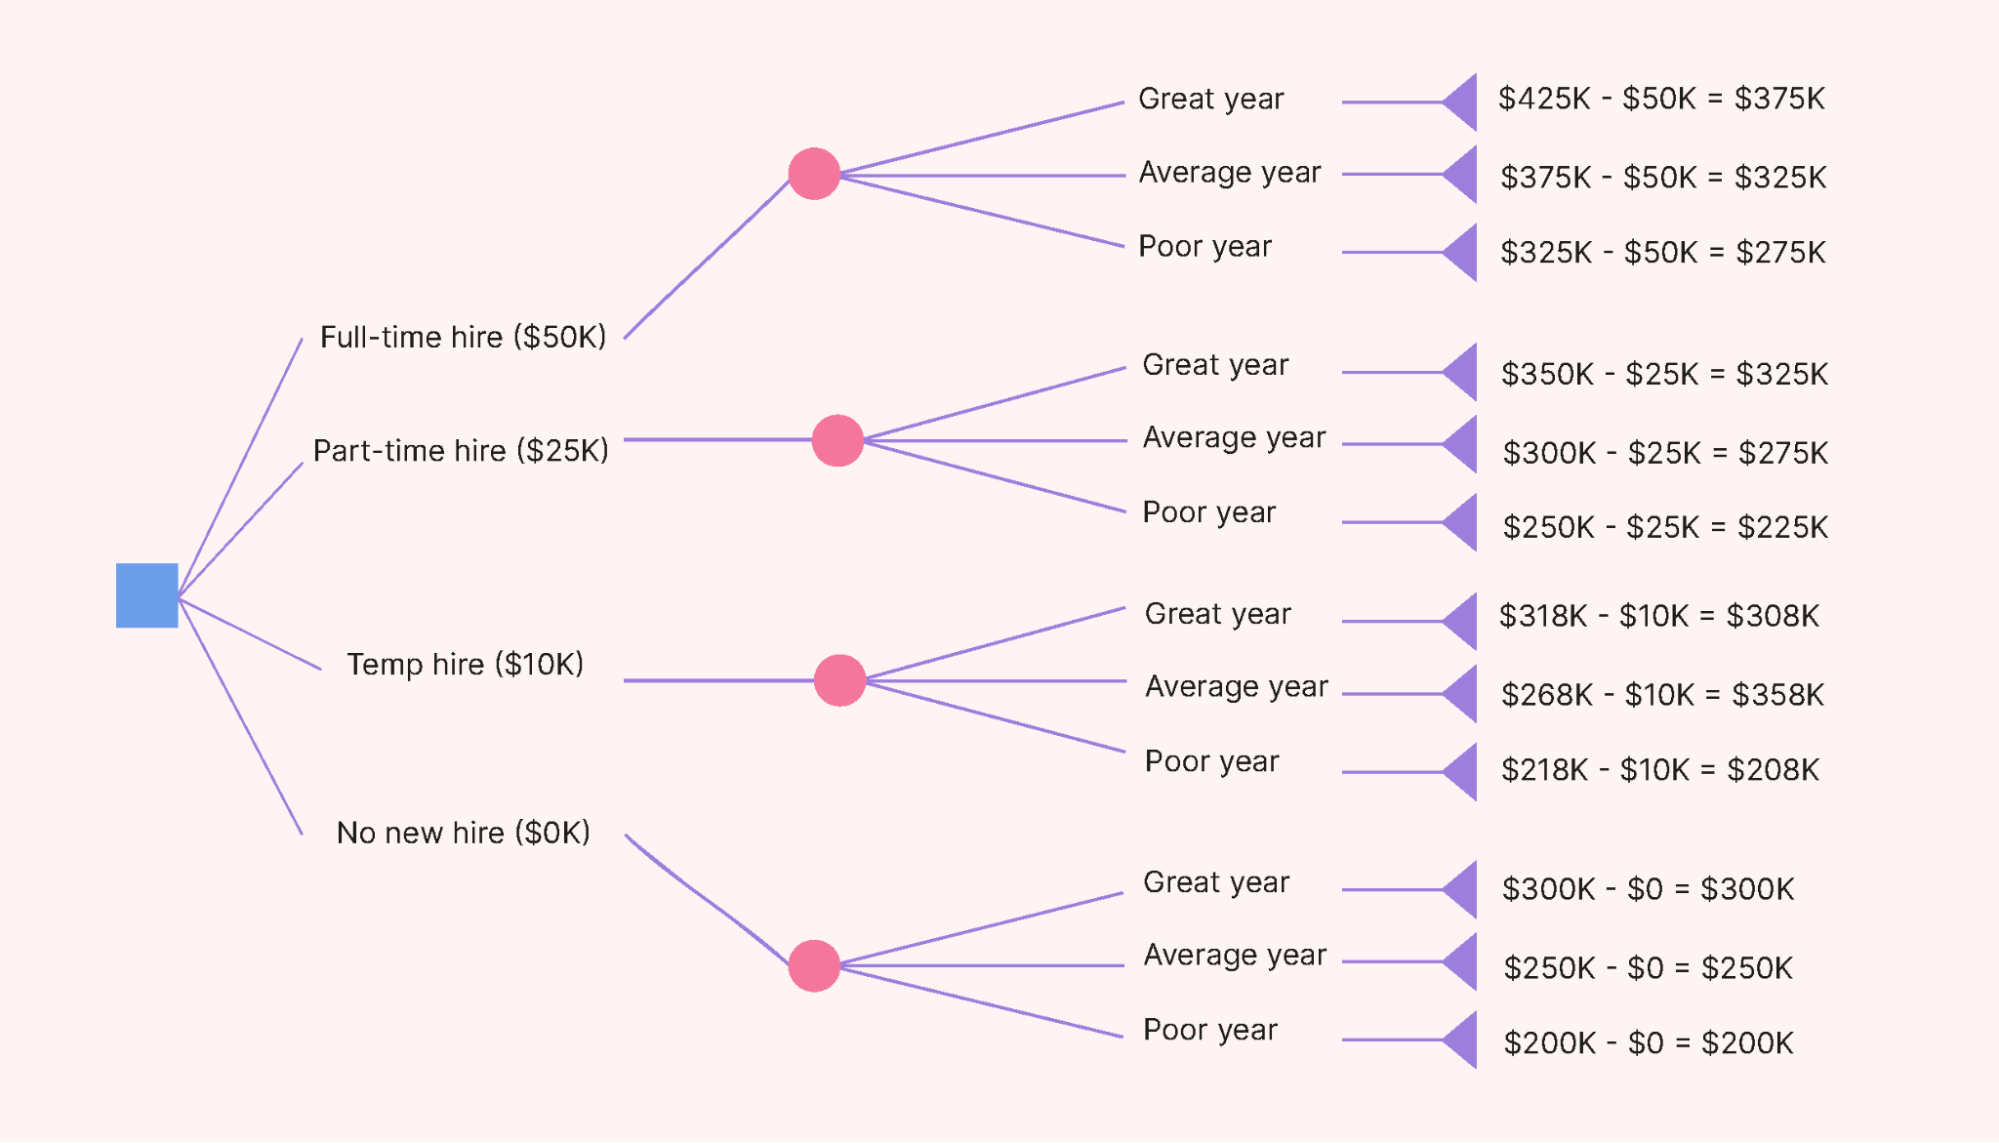 |
We now have a clear picture of the net monetary results of each choice. This allows for detailed analysis and lets us weigh the risks and benefits of one choice against the others.
The owner could draw several helpful conclusions from this step, ranging from obvious to not-so-obvious:
- Regardless of whether the store will experience a poor, average, or great year, hiring a new full-time employee can potentially generate a $75K increase in revenue.
- This potential increased revenue drops to $25K if a part-time worker is hired.
- Hiring one temp helper at peak times does little to increase the net revenue. So, it might be better to consider two temp hires for longer periods. (The owner could redo this part of the decision tree to work out the results of different temp hiring configurations.)
- Maintaining the status quo (with no new hirings) in a great year will probably still bring in $25K less revenue than the revenue generated in an average year after hiring a new full-time employee.
- In that same vein, even in a poor year, having that extra employee could potentially still generate an extra $75K in revenue.
Once the picture of options and possible outcomes becomes clear, the store owner can make an informed hiring decision against the backdrop of a sense of the economic climate for the coming year (the likelihood of the year becoming great, average, or poor) and the level of risk acceptable to the business.
A decision tree diagram can be made much more detailed by, for instance, adding probability calculations to each branch and more depth to the financial or other numerical values the company is using when making major business choices.
But if you apply the steps laid out in this section, you’ll be well on your way to effective decision analysis.
How an online calendar can help with decision tree analysis
One helpful tool for collecting the right raw data for your decision tree branches and options is the online calendar you’re using for your company.
Intelligent tracking software, such as Motion’s AI-driven calendar, is not just a scheduling tool — it can also be a strategic asset in decision-making. For instance, the calendar data can inform and enrich the decision tree analysis process by extracting historical data related to resource allocation and the levels of collaboration in your company.
This can result in decisions that are more aligned with your company’s actual timelines and resource availability — improving the accuracy and reliability of your decision tree analysis and the strategic planning for which you use it.
Making your own decision tree
The quickest way to draw a decision tree is to simply use a piece of paper. This will provide you with a document in hand that you can keep on file and easily modify as needed.
Tip: Draw your diagram with a pencil since you’ll likely be making quite a few changes to it.
A whiteboard is also a good option since colored markers can help distinguish the different steps and options in the tree. The one drawback here would be the decision tree’s impermanence in this scenario — even if you took pictures, you’d have to start over after erasing the board.
Some people use a spreadsheet program, such as Excel, in their decision tree-making process. This is a bit more laborious than drawing by hand, but the symbols and illustrations in the “insert” function are more than enough to draw a decision tree — and you’ll have a permanent record that you can easily update.
In addition to drawing tools on tablets and computers, you have the option of going online and using drawing software. Some of these programs have decision tree templates built in, whereas others let you create your own tree from scratch.
Here are some companies that offer free drawing tools:
Whatever method you choose, make sure to keep a copy of your decision tree — and a record of the reasoning you poured into the analysis — in your files. These documents will come in handy for future decision-making.
Give decision tree analysis a try for your complex decisions
Decision tree analysis is a powerful asset in making complex business decisions. It’s especially helpful if you prefer having a visual representation of a problem to figure out your options.
Remember to tap into the online calendar tool you’re using for your business, as this can help you extract valuable company data that will inform options in your decision tree.
Motion’s AI-driven Intelligent Calendar is one of the best resources for data analysis. Try Motion for free for 7 days to see how it can help you professionalize your decision tree analyses.


