
Data has become an increasingly important resource for businesses looking to grow their customer base, improve efficiency, and generate more profit. With the average number of data sources per organization reaching 400, organizations are turning to dashboard software to simplify complex information and gain valuable insights.
As the demand for robust dashboard software continues to soar, it's important to understand which software to select for your business. This article explores the definition of dashboard software, the top 7 dashboard software of 2025, and the benefits of using dashboard software.
Top 7 dashboard software of 2025
Here’s the list of dashboard software we are going to be discussing in this article.
- Metabase
- Streamlit
- Amplitude
- Tableau
- Microsoft Power BI
- Domo
- Sisense
But before we dive into this software, let’s start with a simple question:
What is dashboard software?
Dashboard software is a centralized platform that enables businesses to visualize and analyze complex information in a simplified and intuitive manner. They help present data in a visually appealing and interactive format, enabling users to monitor key performance indicators (KPIs) and gain actionable intelligence to drive informed decision-making.
At its core, dashboard software acts as a bridge between raw data and meaningful insights. It transforms complex data sets into comprehensible visual representations. This makes it easier for users to understand and interpret the information at a glance. Dashboards typically consist of charts, graphs, tables, and other visual elements that condense large volumes of data into concise and meaningful displays.
They provide a real-time snapshot of an organization's performance by aggregating data from multiple sources. These sources can include various systems such as customer relationship management (CRM) tools, enterprise resource planning (ERP) systems, web analytics platforms, and social media platforms. By integrating data from these sources, dashboard software reveals a holistic view of the business, facilitating data-driven decision-making across different departments and improving business processes.
What are the benefits of using dashboard software?
Dashboard tools offer numerous advantages to organizations across industries. Here are some key benefits of using dashboard software.

1. Data visualization
Dashboard software excels at transforming complex data sets into visually intuitive charts, graphs, and other visual elements. This visual representation enables users to quickly grasp the meaning behind the data, identify patterns, and detect trends. Visualizing data in an easily understandable format helps businesses make faster decisions and enhances data comprehension across the organization.
2. Real-time data monitoring
Dashboard software enables real-time monitoring of important metrics and KPIs. It allows organizations to track real-time data from various sources and systems in real-time, providing an up-to-date and accurate snapshot of performance. Real-time monitoring empowers businesses to respond promptly to critical events or changes, enabling proactive decision-making and timely interventions. This feature is particularly valuable in industries where quick responses are essential, such as finance, healthcare, and cybersecurity.
3. Centralized data access
Dashboard software offers a centralized hub for accessing and analyzing data from multiple sources. Instead of searching through disparate systems and files, business users can easily connect data sources to a single dashboard, consolidating information in one place. This centralized access simplifies data retrieval and ensures that users have a unified and comprehensive view of their organization's data. It eliminates data silos, improves data governance, and promotes data-driven decision-making across departments.
4. Improved data accuracy
Dashboard software helps maintain data accuracy by connecting directly to data sources and updating in real time. It eliminates the manual and error-prone process of data entry and manipulation, reducing the risk of data inconsistencies or inaccuracies. Additionally, dashboard software often includes data validation and cleansing features, ensuring that the displayed information is reliable and trustworthy. Improved data accuracy enhances decision-making by providing reliable insights based on high-quality data.
5. Enhanced collaboration and communication
Dashboard software fosters collaboration and communication within organizations. It allows multiple users to access and interact with the same dashboards simultaneously, promoting teamwork and knowledge sharing. Users can collaborate on data analysis, share insights, and discuss findings, leading to better collective decision-making. Moreover, dashboard software often provides features like data commenting and sharing, enabling users to annotate specific data points or share dashboards with stakeholders or team members easily. You can find out our in-depth guide on the top 5 collaboration tools for businesses for more information on collaboration tools.
6. Customization and personalization
Dashboard software offers extensive customization and personalization options to meet the specific needs of different users and departments. Users should have access to customizable dashboards that display the most relevant information, be able to choose visualization types that best represent their data, and arrange elements according to their preferences. This customization empowers users to tailor their dashboards to their workflows and priorities, improving efficiency and user satisfaction.
7. Performance tracking and goal management
Dashboard software allows organizations to track performance against predefined goals and benchmarks. By visualizing key metrics related to specific objectives, businesses can monitor progress in real-time and identify areas that require attention. Performance tracking dashboards provide a clear overview of goal attainment, enabling organizations to adjust strategies, allocate resources effectively, and drive continuous improvement. For more information regarding progress tracking, check out our article on how to use a progress tracker to deliver successful projects.
8. Scalability and flexibility
Dashboard software offers scalability and flexibility, accommodating the changing needs of organizations. It can handle large volumes of data and adapt to evolving data sources, ensuring that organizations can scale their analytics capabilities as they grow. Furthermore, dashboard software supports integration with other tools and systems, enabling seamless data flow and enhancing the overall analytics ecosystem.
Top 7 dashboard software of 2025
Businesses can choose from a diverse range of cutting-edge dashboard software options, each offering unique features and capabilities. In this section, we'll explore the top 7 dashboard software of 2025 (including three that we use here at Motion — Metabase, Streamlit, and Amplitude), highlighting their features, potential use cases, and pricing.
1. Metabase
Metabase is a leading dashboard and visualization tool that empowers businesses to unlock the full potential of their data. With its user-friendly interface and powerful analytics capabilities, Metabase provides organizations with a comprehensive solution to visualize and analyze data effortlessly. Its intuitive drag-and-drop interface enables users to easily create interactive dashboards and visualizations without requiring advanced technical skills.
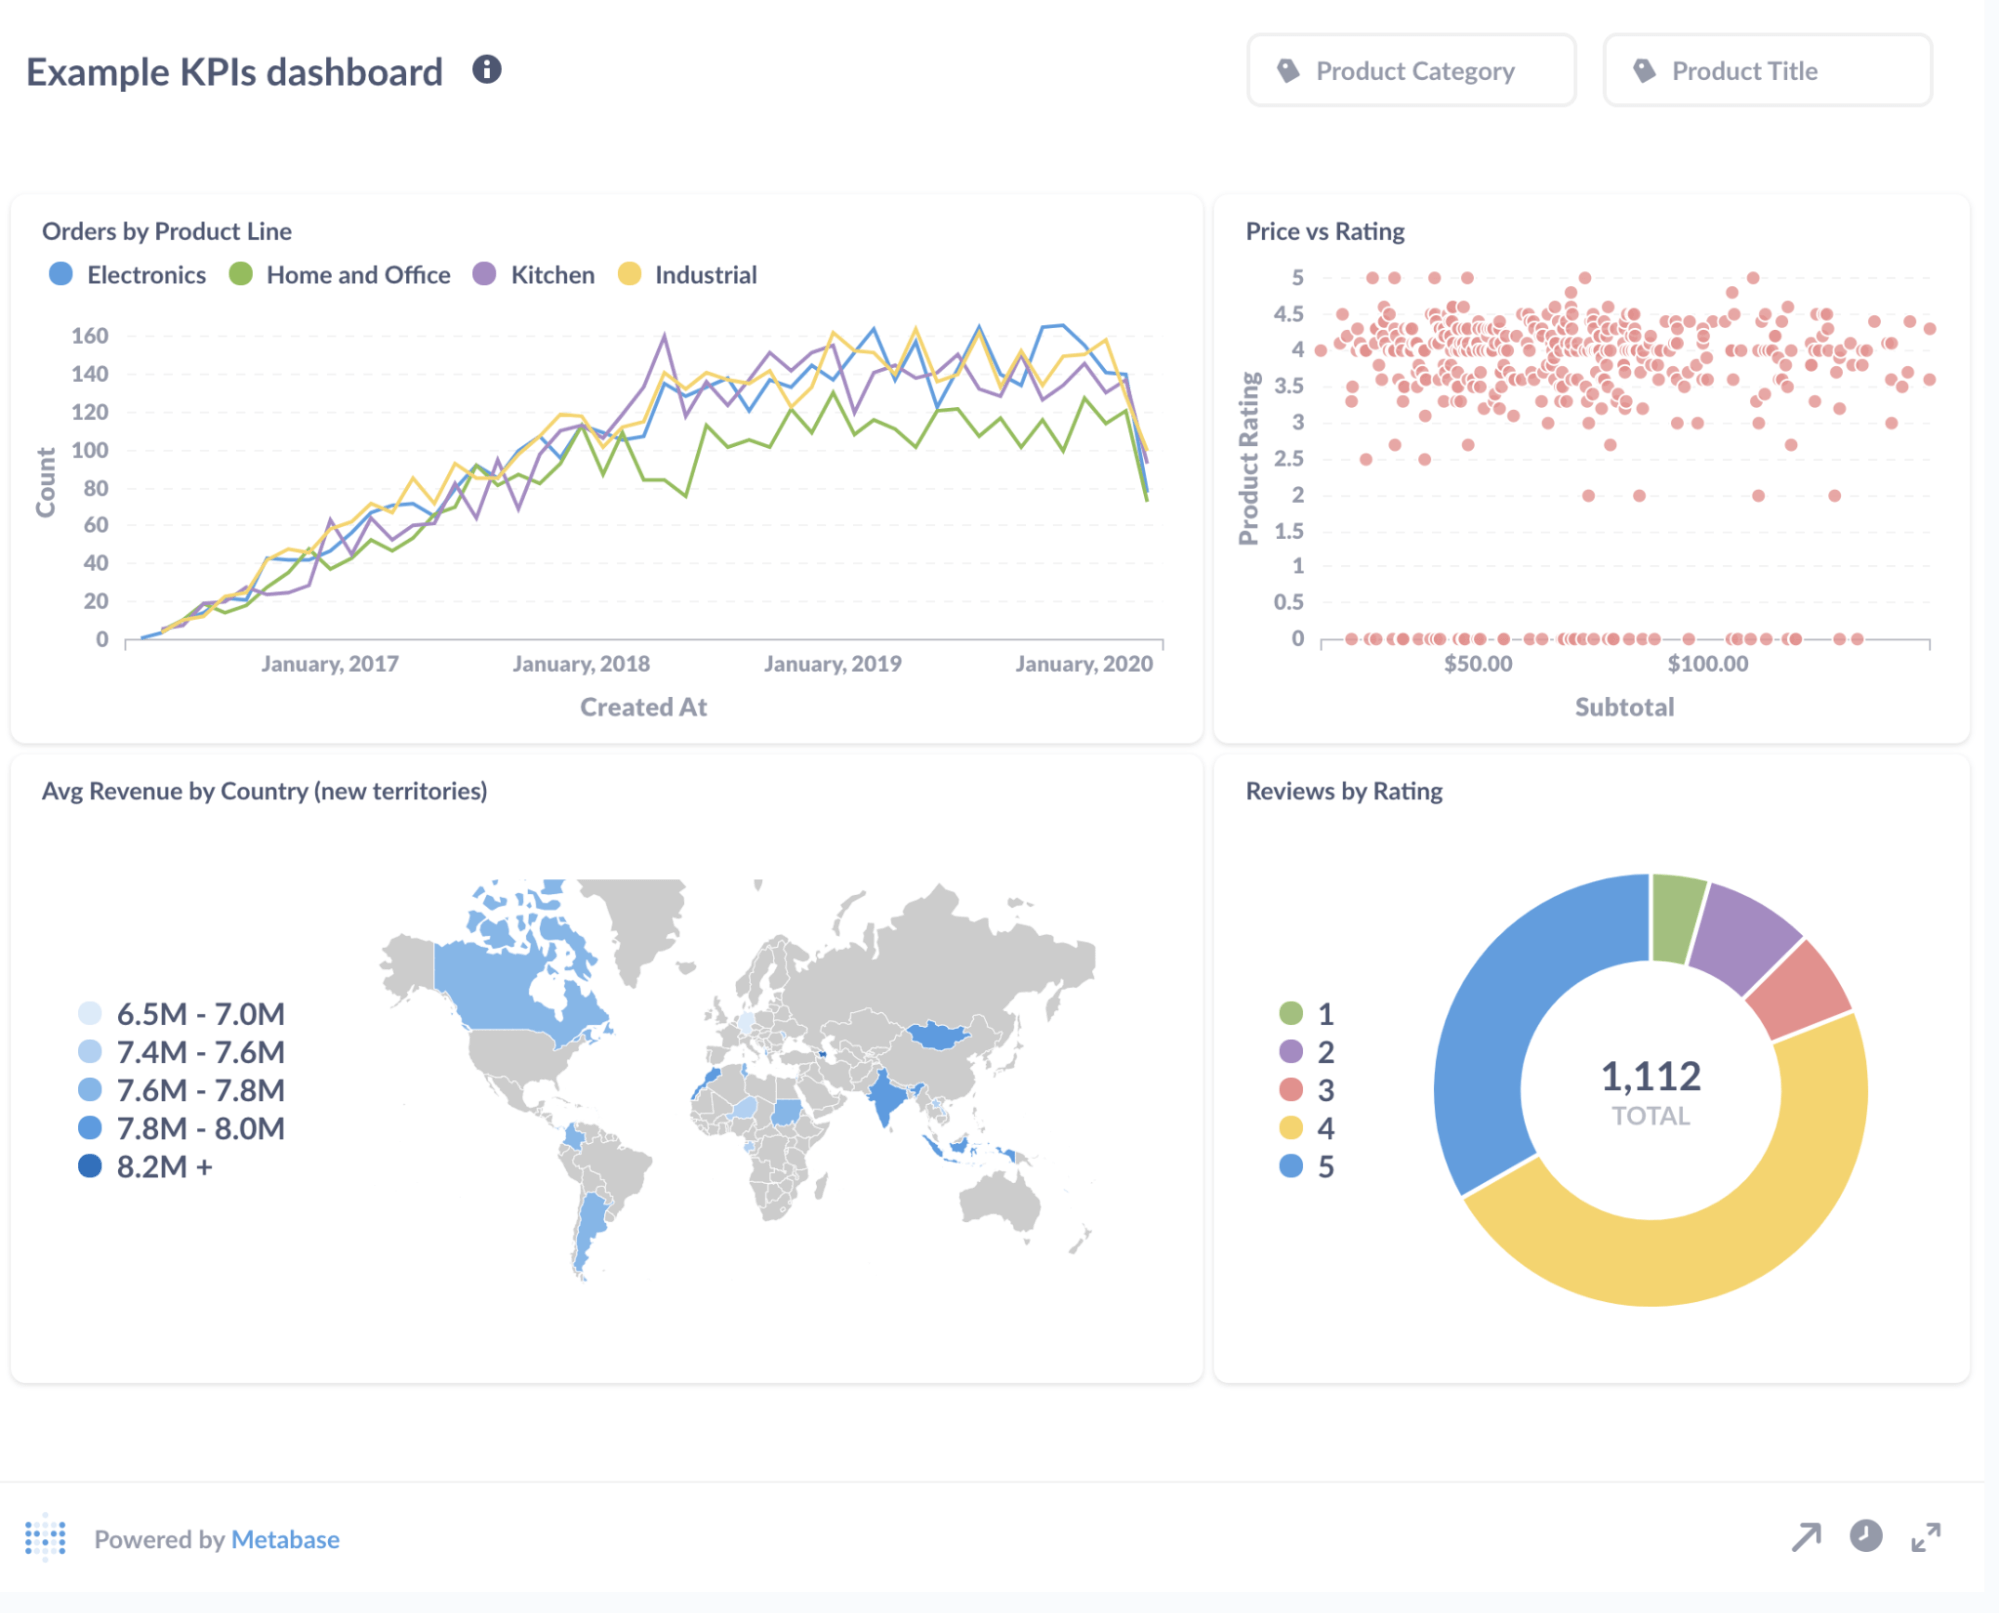
Metabase's natural language querying allows users to ask questions in plain English and receive instant answers, making data exploration accessible to everyone in the organization. Additionally, Metabase supports a wide range of data sources, allowing users to connect and integrate data from various databases and platforms seamlessly.
Metabase offers both an open-source version and a commercial version. The open-source version is free and provides access to the core features of Metabase. The commercial version offers additional functionalities and support options, with three pricing options: Starter ($85/5 users/month), Pro ($500/10 users/month), and Enterprise (starts at $15k/annually). Additionally, Metabase provides a free 30-day trial for the commercial version, allowing businesses to experience the full capabilities of the software before making a purchasing decision.
With its user-friendly interface, powerful key features, and advanced dashboard reporting features, Metabase emerges as a top choice for businesses seeking to harness the power of data through interactive and insightful dashboards.
2. Streamlit
Streamlit is an open-source business dashboard software that enables businesses to easily build interactive web-based dashboards and applications. It offers a great user experience with its easy-to-use interface and simple syntax. Streamlit allows users, including Google data scientists and developers, to create powerful and customized dashboards with ease.
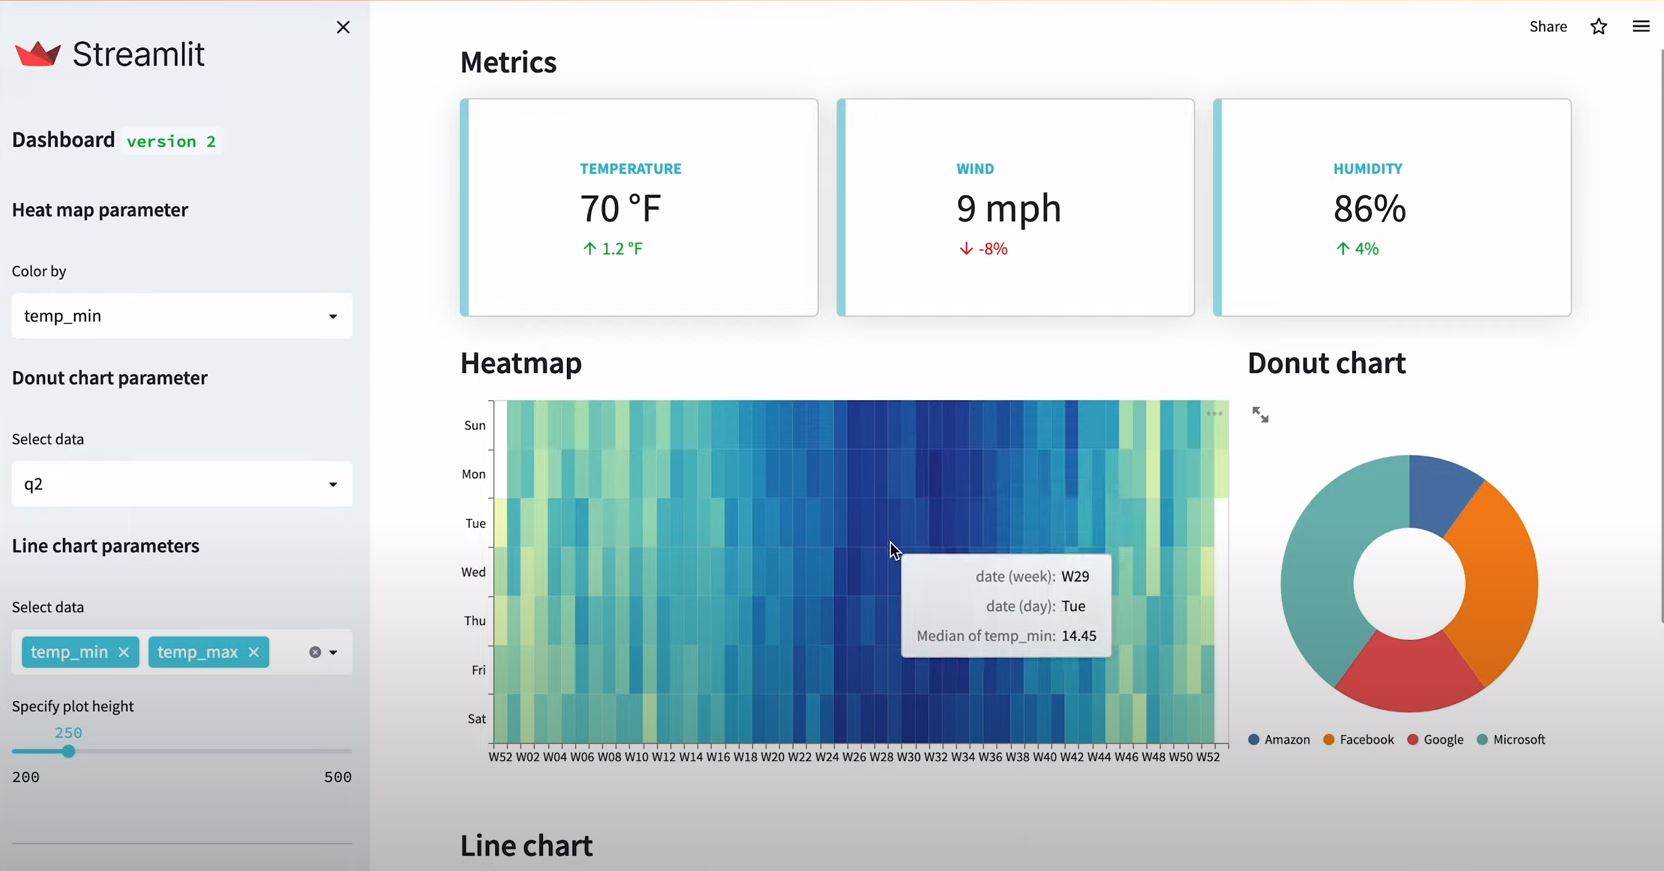
The intuitive drag-and-drop functionality and streamlined Python coding experience make it accessible to users of all technical backgrounds. Streamlit supports data exploration and visualization, allowing users to connect to various data sources and create interactive visualizations.
Being an open-source software, Streamlit is free to use, and there are no associated pricing plans or charges.
3. Amplitude
Amplitude is a leading dashboard software that specializes in product analytics and user behavior tracking. It provides businesses with the tools to gain valuable insights into user interactions and engagement with their digital products or services.
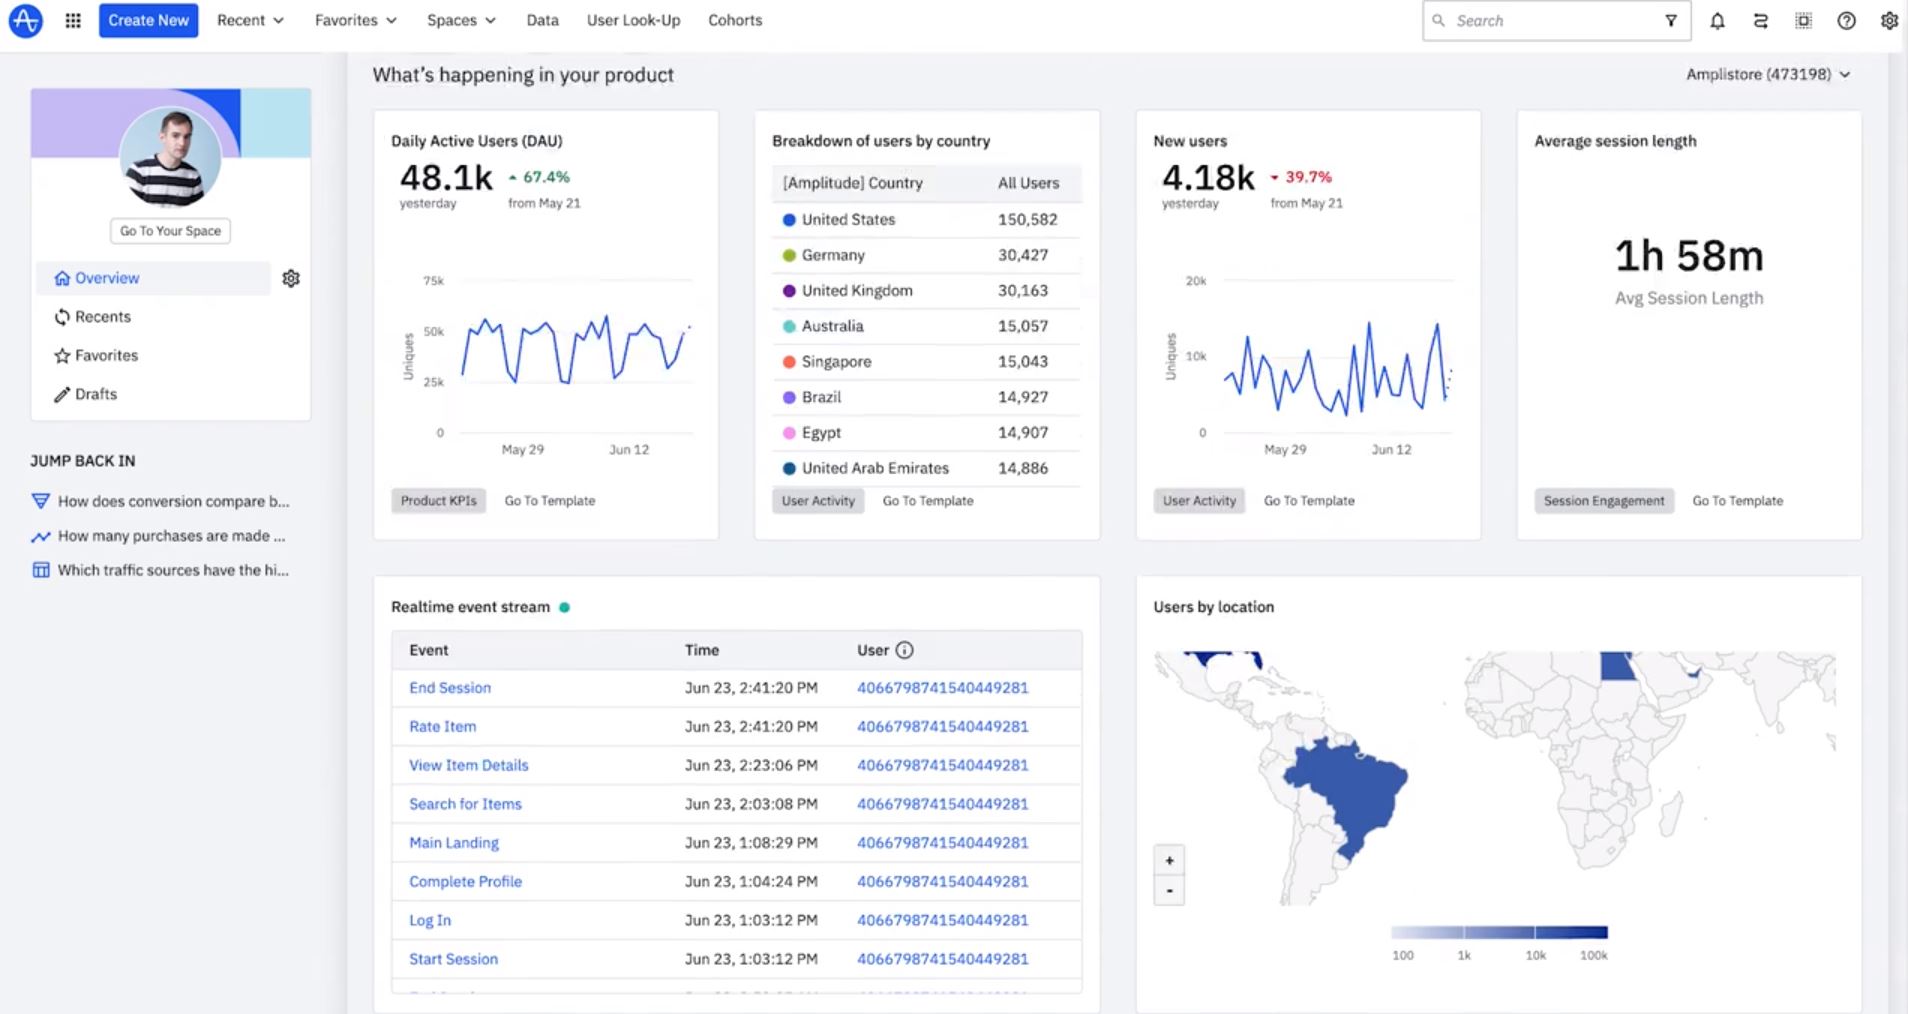
Amplitude offers a user-friendly interface and a wide range of key features for data visualization, cohort analysis, funnel analysis, and user segmentation. Users can create custom dashboards to monitor key metrics, track user journeys, and identify areas for optimization. Amplitude offers three different plans: Starter, Growth, and Enterprise, all with custom prices. They also offer a 14-day free trial for their Starter plan.
Amplitude, an analytic dashboard application, offers an intuitive interface that empowers businesses to unlock the potential of their data. With its robust key features and advanced reporting capabilities, Amplitude stands out as a premier solution for organizations looking to leverage interactive and insightful dashboards.
4. Tableau
Tableau has established itself as a leading business dashboard software known for its robust data visualization capabilities. With a user-friendly interface and a wide array of pre-built templates, Tableau enables users to create visually stunning dashboards effortlessly. Its intuitive drag-and-drop functionality allows users to explore real-time updates from multiple sources and generate interactive visualizations. Tableau also excels in data connectivity, supporting various data formats and offering seamless integration with popular applications.
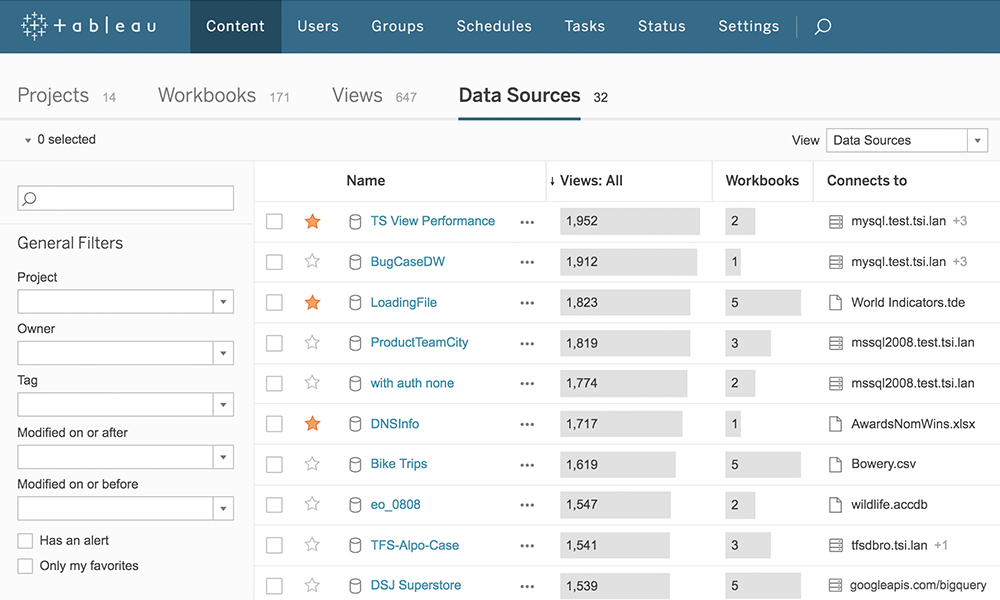
Tableau offers three paid plans: a creator plan for $70/user/month, an explorer plan for $42/user/month, and a viewer plan at $15/user/month, all billed annually. Students and teachers of accredited institutions can get a year's free trial of Tableau licenses, while others can trial the software for 14 days.
5. Microsoft Power BI
Microsoft Power BI is a widely used dashboard software that offers advanced data visualization and business intelligence capabilities. With a user-friendly interface and a wide range of pre-built templates and visuals, Power BI enables users to create visually stunning dashboards and reports effortlessly to provide real-time insights.
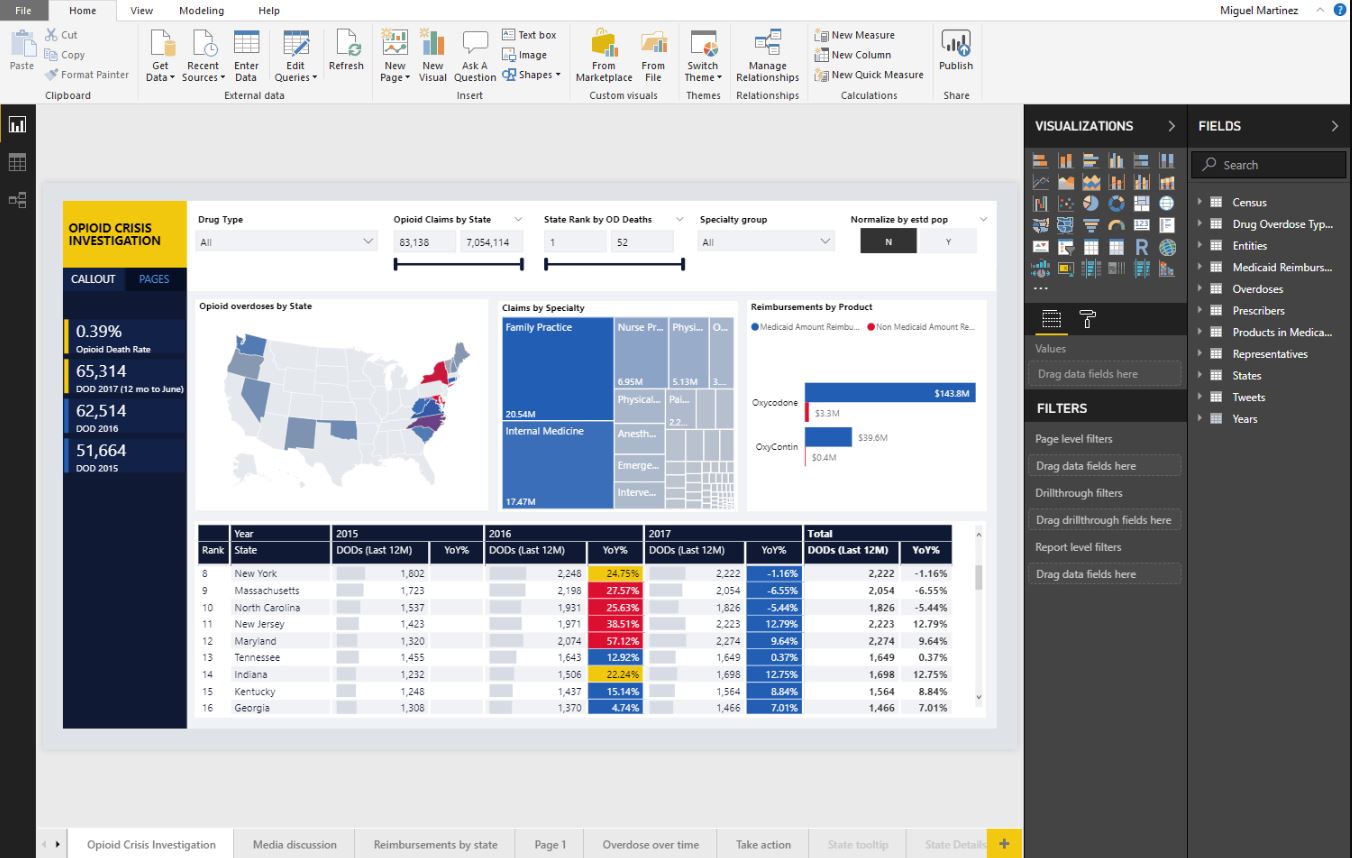
Power BI supports seamless integration with various data sources, allowing users to connect to multiple databases, cloud services, and APIs. Power BI offers a free version with limited features. For more advanced functionality and capabilities, they also offer paid plans — Power BI Pro ($10/user/month) and Power BI Premium ($20/user/month and $4,995/capacity/month).
6. Domo
Domo is a comprehensive business intelligence dashboard software that combines data integration, visualization, and collaboration features. It allows users to connect to various data sources, both internal and external, and consolidate them into a unified view.
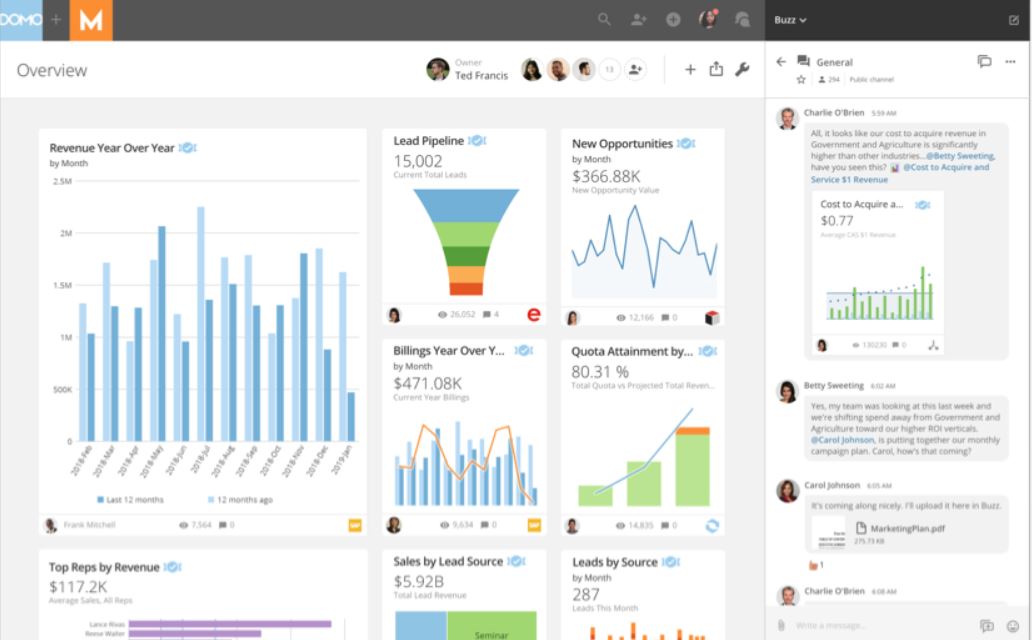
Domo offers a wide range of customizable visualizations, empowering users to create interactive dashboards and reports tailored to their specific needs. It provides features for real-time updates, data exploration, analysis, and sharing, promoting collaboration and data-driven decision-making within organizations.
Domo offers a 30-day free trial and custom pricing plans tailored to different business needs.
7. Sisense
Sisense is a powerful dashboard software that specializes in complex data analysis and visualization. It enables users to connect and merge data from multiple sources, both structured and unstructured, into a unified dataset.
Sisense offers a wide range of visualizations and widgets, allowing users to create dynamic and interactive dashboards and reports. It provides advanced analytics capabilities, including predictive modeling and machine learning, empowering users to uncover insights and patterns in their data.
They offer a 14-day free trial and custom pricing plans tailored to different business sizes and needs.
Conclusion
As we conclude our exploration of the top seven dashboard software of 2025, it’s evident that businesses have a diverse range of powerful tools at their disposal to harness the potential of data visualization and analysis. These dashboard software solutions offer a multitude of features that cater to the unique needs of organizations across industries.
Regularly exploring and evaluating the latest offerings helps businesses adapt to changing needs and take advantage of emerging technologies in the field of data visualization and analysis. For an all-in-one software that manages all your calendars, meetings, and tasks, start your free trial of Motion today.


