
In today's fast-paced and complex business environment, effective communication and efficient processes are crucial for the success of any organization. While trust between employees and employers is vital, process documentation through workflow charts gives managers the assurance that every employee understands how the business processes work, and are clear on what goals to focus on at every given point in time.
In this article, we discuss the definition of workflow charts, common workflow chart symbols, uses and types of workflow diagrams, and how you can create a flow chart.
What is a workflow chart?
A workflow chart, also known as a workflow diagram or process flow diagram, is a graphical representation of a business process. It provides a clear and structured overview of the sequence of tasks, decisions, and interactions within a system or process.
A workflow chart typically uses various shapes and symbols to represent different elements of the workflow, such as rectangles, ovals and arrows. Each step in the chart is connected to the next step, illustrating the logical progression of the workflow.
The purpose of a workflow chart is to simplify complex processes and make them easier to understand and analyze. It helps identify bottlenecks, inefficiencies, or areas for improvement within a process. Additionally, workflow charts are commonly used as a communication tool, allowing individuals or teams to discuss and collaborate on process mapping, optimization, or troubleshooting.
Workflow charts are widely used in various industries and domains, including project management, software development, manufacturing, healthcare, and business process improvement.
Overall, a workflow chart helps stakeholders gain a better understanding of how tasks are interconnected and how the workflow progresses from start to finish.
Uses of a workflow chart
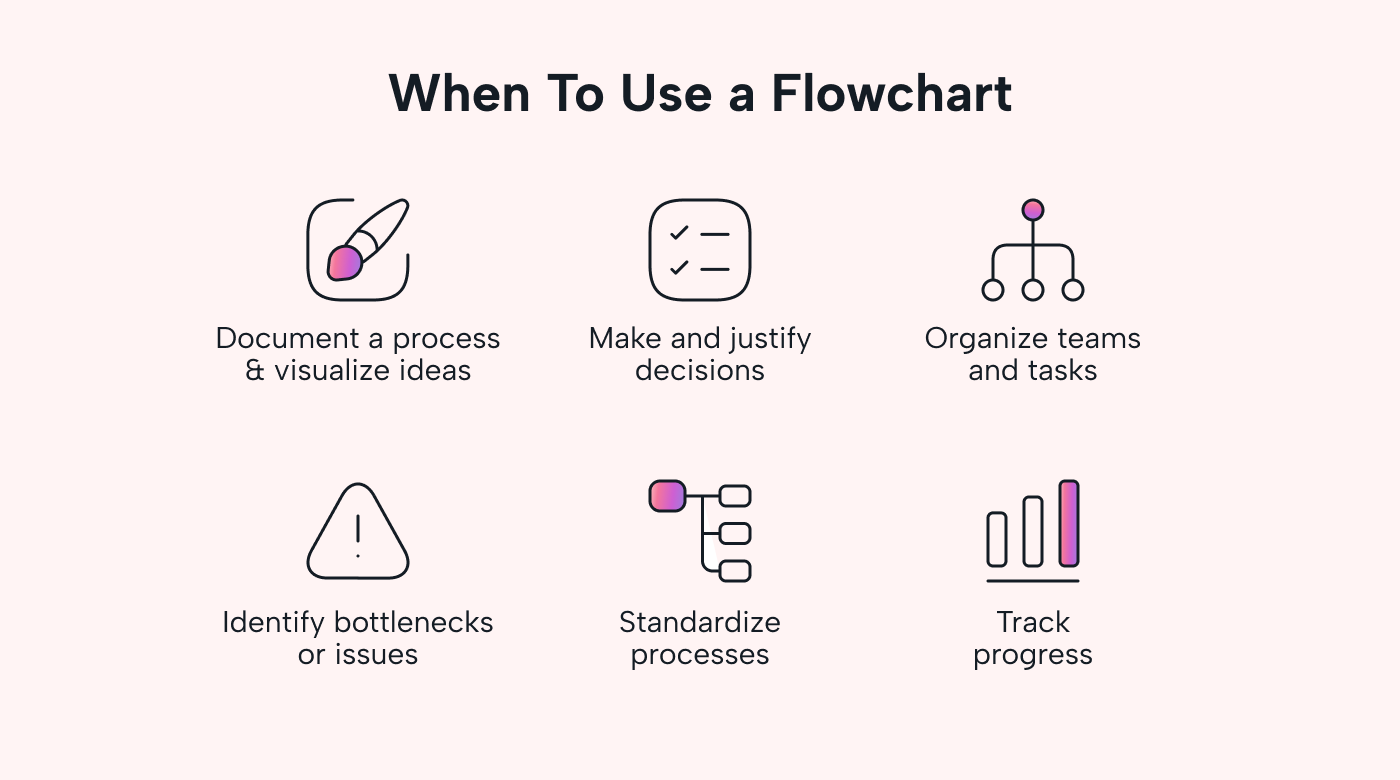 |
Workflow charts are essential for a variety of purposes, including creating efficient and documented processes, eliminating communication breakdowns, and improving productivity. Here are some of the top reasons you should consider using workflow charts.
1. Process improvement
One of the key uses of a workflow chart is to facilitate process improvement within an organization. By visually mapping out the steps and activities involved in a process, workflow charts provide clarity of how work flows and where potential bottlenecks or inefficiencies may exist. Employees who have clarity about their work priorities are 4.5 times more likely to say they're happy at their job, and 7.1 times less likely to look for a new job.
Analyzing a workflow chart also enables businesses to identify areas for improvement and streamline their processes. This helps organizations reduce redundant tasks, eliminate unnecessary steps, and enhance overall efficiency. This leads to cost savings, time savings, and improved productivity.
2. Training
Workflow charts also play a crucial role in training new employees or cross-training existing staff. By providing a visual representation of the workflow, new hires can quickly understand how tasks are interconnected and how their work fits into the larger process. This reduces the learning curve and enables employees to become productive more quickly.
Workflow charts can also serve as reference materials during training sessions, ensuring that employees have a clear understanding of the sequence of tasks and the expected outcomes.
3. Communication
Effective communication is vital for smooth workflow and collaboration within an organization. Workflow charts ensure that work processes and protocols are clearly laid out and understood. They provide a shared understanding of the workflow, which helps eliminate communication breakdowns and misunderstandings.
This clarity improves communication and coordination, allowing team members to work together more effectively towards a common goal.
4. Project management
Workflow charts are valuable tools in project management, particularly for complex projects involving multiple tasks, teams, and deadlines. By providing a visual representation of the project workflow, they help project managers track progress, identify potential bottlenecks, and allocate resources effectively.
This enables them to set realistic timelines, allocate resources efficiently, and identify any potential risks or delays. Workflow charts also facilitate communication among project team members, ensuring that everyone is aware of their roles and responsibilities. For information about project management, read our article on best project management software available today.
5. Compliance
Another important use of a workflow chart is to ensure compliance with regulations, standards, and internal policies within an organization. Many industries have specific requirements that businesses must adhere to, and failing to comply can result in legal and financial consequences.
They help organizations and software developers document and visualize their compliance processes, ensuring that all necessary steps are followed and recorded. By mapping out compliance workflows, businesses can identify potential gaps or inefficiencies in their processes. This allows them to make the necessary adjustments to ensure full compliance with regulations.
Furthermore, workflow charts serve as a tool for auditing and inspections. They provide a clear record of the steps taken to meet regulatory requirements, demonstrating that the organization has implemented and followed the necessary processes.
Common workflow chart symbols
Workflow charts use standardized symbols and shapes to convey information about the wide range of steps, decisions, and actions that occur within a workflow. Understanding these symbols is essential for interpreting and creating workflow diagrams effectively.
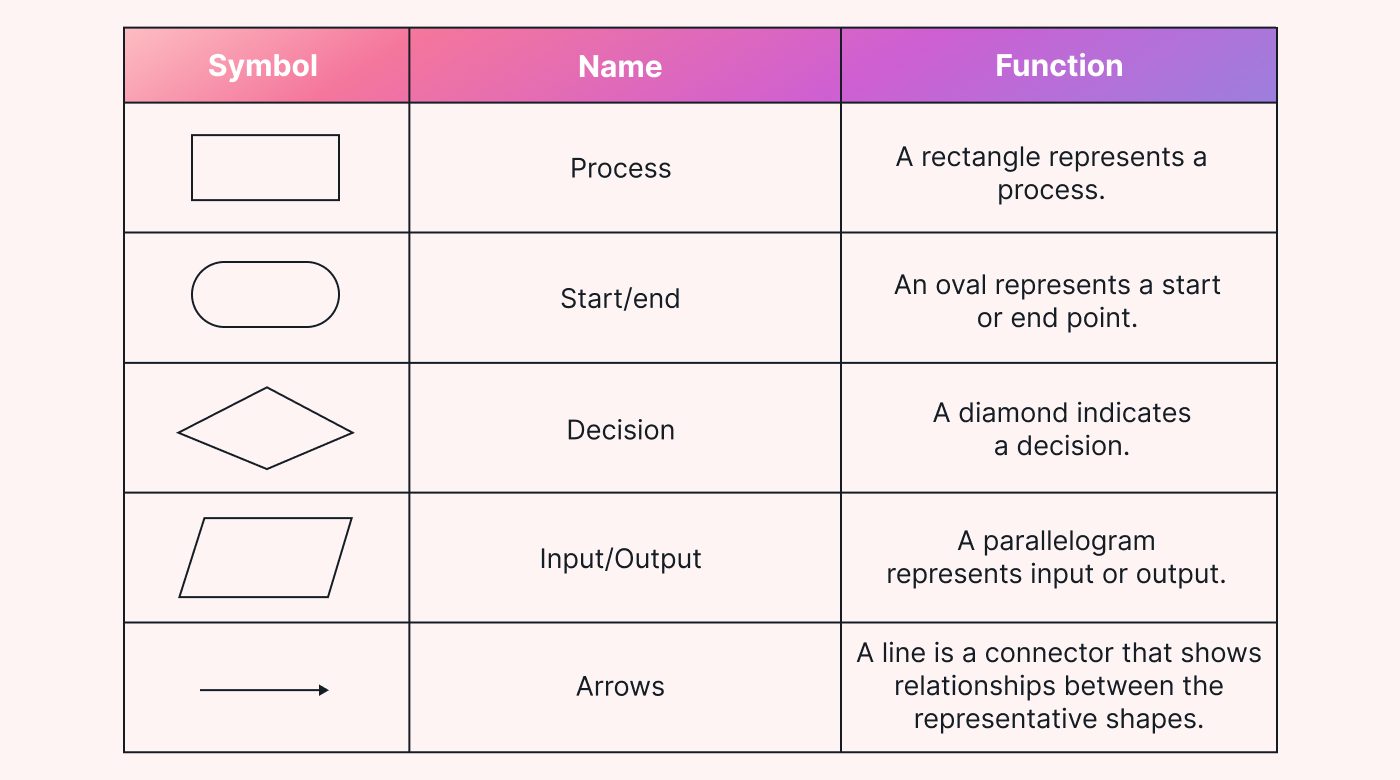 |
Here are a few of the most common flowchart shapes and what they mean.
1. Diamond
The diamond symbol is a flowchart shape often used to represent decision points within a workflow. It signifies a branching path where a decision needs to be made based on certain criteria or conditions. The flow of the workflow chart then splits into different paths depending on the decision made.
2. Oval
Ovals are basic symbols typically used to represent the start and end points of a workflow. It marks the beginning and the conclusion of the process or sub-process being depicted in the chart.
3. Arrow
Arrows are used to depict the direction of flow and sequence of steps from one step to the next within a workflow. Arrows connect the various symbols and shapes in the chart, showing the sequence of actions or decisions within the workflow.
4. Rectangle
Rectangles are a flowchart shape used to represent tasks within a workflow. Each rectangle represents a specific action or operation that needs to be performed. The flow typically moves from one rectangle to the next, indicating the order in which the tasks are carried out.
5. Parallelogram
The parallelogram symbol is used to represent input or output in a process diagram. It signifies the point where data or information is either received or generated as part of the process. The flow enters or exits the parallelogram to indicate the input or output of data.
Types of workflow charts
There are different types of flowcharts, each used to serve specific processes. Here are some common types of workflow charts:
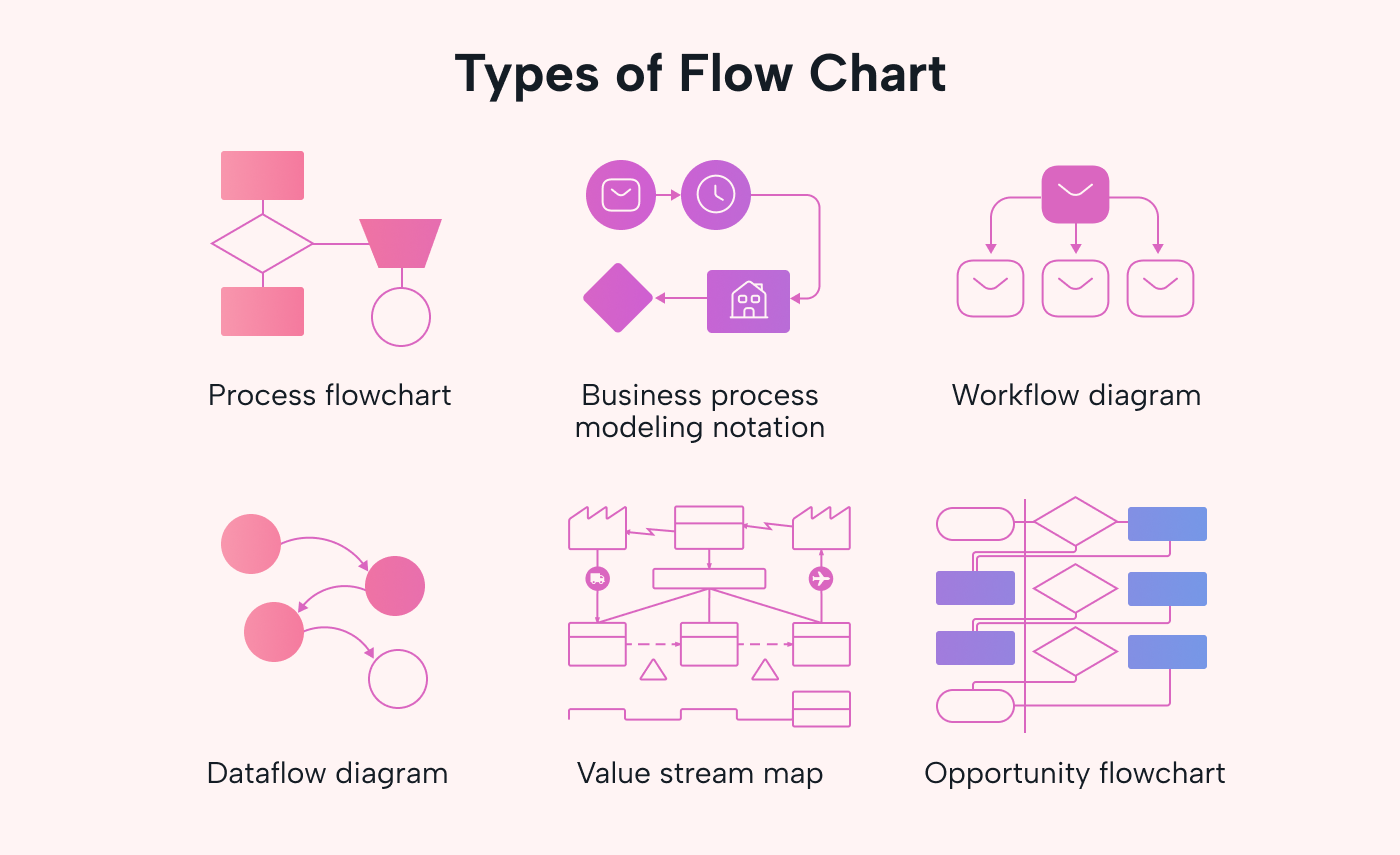 |
1. Process flowchart
A process flowchart is the most commonly used type of flowchart. It illustrates the sequential steps of a process, showing the flow of tasks, decisions, and actions. Process flowcharts use symbols and arrows to represent each step and the connections between them.
2. Swim lane diagram
A swim lane diagram, also known as a cross-functional flowchart, provides a visual representation of how different departments or individuals contribute to a process. It uses "swimlanes" to indicate the responsibilities or roles of various stakeholders, allowing for clear visibility of who is accountable for each step.
3. Business process model and notation (BPMN) diagram
BPMN is a standardized notation system used for modeling and documenting business processes. It employs a set of graphical symbols to represent tasks, events, gateways, and other elements within a workflow. BPMN diagrams provide a comprehensive view of the process, including both the sequence of activities and the associated business rules.
4. Value stream map
Value stream maps are commonly used in Lean and Six Sigma methodologies to identify and eliminate waste in a workflow process. They depict the flow of materials, information, and actions required to deliver value to the customer. Value stream maps help organizations identify areas of improvement and streamline processes to increase efficiency.
5. Data flow diagram
Data flow diagrams illustrate the movement of data within a system or process. They show how data is input, processed, and output, as well as any storage or transformations that occur along the way. Data flow diagrams are commonly used in software development and systems analysis to understand data dependencies and interactions.
6. Workflow state diagram
A workflow state diagram is a detailed flowchart that represents the different states or statuses that a task or process can have. It shows the transitions between states and any conditions or actions required to move from one state to another. Workflow state diagrams are useful for visualizing the progress and status of ongoing processes.
How to create a workflow chart
Here’s a step-by-step guide to help you create effective workflow charts for your specific needs. We'll cover everything from identifying your process to choosing the right workflow chart to use, and provide tips for reviewing your chart. By following these guidelines, you can create a workflow chart that'll help you optimize your workflows and achieve your goals.
 |
1. Identify the process
Start by clearly identifying the process or workflow you want to chart. Define the specific steps, actions, and decisions involved in the process. Understanding the process in detail is crucial to accurately representing it in the workflow chart.
2. Gather information
Collect all the necessary information related to the process. This may include process documentation, standard operating procedures, interviews with stakeholders, or observation of the workflow in action. Ensure that you have a comprehensive understanding of how the process works and the roles and responsibilities of the individuals involved.
3. Choose the type of workflow chart you want to use
Consider the different types of workflow charts available, such as process flowcharts, swimlane diagrams, BPMN diagrams, value stream maps, data flow diagrams, or workflow state diagrams. Choose the one that best suits your needs and effectively represents the process you're documenting.
4. Create the chart
a. Start with the beginning and end
Use an oval to represent the start and end points of the workflow.
b. Map out the steps
Use symbols and shapes to represent each step or action in the process. Rectangles are commonly used for tasks, diamonds for decision points, and parallelograms for input or output. Connect the symbols with arrows to depict the flow of the process.
c. Add details and annotations
Include additional information, such as task descriptions, decision criteria, timeframes, or relevant data, to enhance understanding. Annotations can be added directly to the chart or in a separate key or legend.
d. Use colors and formatting
Utilize colors, shading, or different line styles to differentiate between different departments, decision paths, or other meaningful distinctions. This makes the chart visually appealing and easier to interpret.
5. Review and revise the chart
Once you have created the initial workflow chart, review it carefully. Ensure that the chart accurately represents the process and is easy to understand. Consider the following points during the review:
a. Logical flow
Check that the steps and actions follow a logical sequence and that there are no gaps or overlaps in the process.
b. Clarity
Make sure that the symbols, arrows, and annotations are clear and easily distinguishable. Make sure that the chart isn't cluttered with unnecessary details.
c. Consistency
Verify that the chart is consistent with the actual process and that it aligns with all existing documentation or procedures.
d. Stakeholder feedback
Seek input and feedback from stakeholders who are familiar with the process. Incorporate their suggestions and revisions to improve the accuracy and clarity of the chart.
6. Finalize and share the chart
Once you've reviewed and revised the workflow chart, finalize it by creating a neat and clear version. Consider using digital tools or specialized software for creating professional-looking charts. Share the chart with relevant stakeholders, such as team members, managers, or process owners, to ensure a shared understanding of the workflow.
It’s also important to know that workflow charts aren't static documents. As processes evolve and improve, it's essential to update and revise the workflow chart accordingly.
Conclusion
Workflow charts are an essential tool for understanding, optimizing, and communicating complex processes. By using diagrams to represent process steps, decisions, and actions, workflow charts provide a clear and concise picture of the workflow.
In this article, we have covered the basics of workflow charts, including the different types of workflow charts, the most common symbols used in workflow charts, and how to use a flow chart.
If you are looking to create your own workflow charts, try out Motion today for a free 7-day trial.


