
Managing a project can be daunting, especially when trying to keep track of progress and resources. Without the right tools and strategies, even the most experienced project managers can find themselves dropping the ball.
But what if there was a tool that could help you visualize your project's progress to help you keep it on track?
That's where the S-curve comes in.
The S-curve is a tried and tested tool project managers have used for over a century. By providing a graphical representation of cumulative work completed versus time, S-curves allow project managers to see how their project is progressing at a glance.
Below we'll explore an S-Curve, its history, and how to use it in project management. By the end, you'll have a comprehensive understanding of the S-curve and how to use it to take your project management skills to the next level.
What is an S-curve?
An S-curve is a mathematical graph that shows the cumulative progress of work completed in a project over time with an S-shaped curve. The horizontal axis represents time, while the vertical axis represents the amount of work completed. The curve itself forms an S-shape, which is why it's called an S-curve.
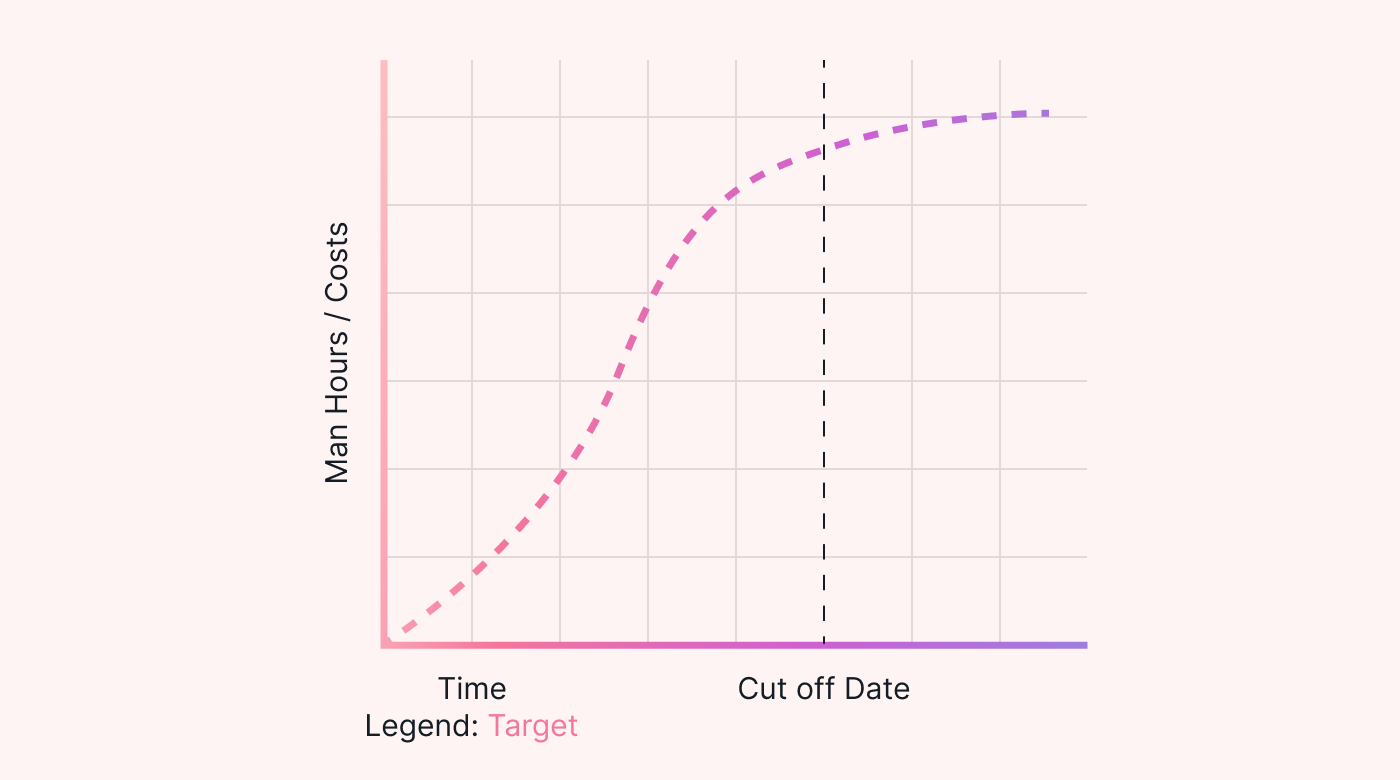 |
S-curves are commonly used in project management to track progress, monitor performance, and estimate completion time. By plotting the actual progress of work against the planned progress, project managers can determine if the project is on track, behind schedule, or ahead of schedule.
They can also identify potential problems and take corrective action to keep the project on track.
S-curves are widely used in various industries, including construction, engineering, and IT.
In the construction industry, S-curves are used to check the progress of large construction projects, such as building construction. In IT, they're used by software developers to ensure that programs are completed on time and within budget.
History of the S-curve?
The S-curve was first introduced in the manufacturing industry in the early 20th century to track production processes. The idea was to plot cumulative production against time to get a visual representation of the progress of the production process.
Over time, the S-curve found applications in other fields, such as construction and project management. In the construction industry, it's used to track the progress of large construction projects, as noted above. Similarly, in project management, the S-curve is used to track the progress of projects by plotting the cumulative work completed against time.
Today, the S-curve is an essential tool for project managers to track and control the progress of projects.
It visually represents the project's progress and helps project managers predict the time it'll take to complete a future project. It also helps monitor progress to ensure the project stays on schedule.
What does an S-curve represent in project management?
An S-curve is an important tool in project management to track and measure project progress. By analyzing the S-curve, project managers can identify if the project is progressing according to plan or if there are any delays or deviations.
If there are any issues, corrective action can be taken to get the project back on track.
Types of S-curves in project management
Project managers use different types of S-Curves depending on the project's specific needs.
These include:
- Planned S-curve: This shows the planned work progress over time, as outlined in the project plan. It is used to compare with the actual progress made.
- Baseline S-curve: This represents the originally planned work progress, corresponding with the current progress to identify deviations.
- Actual S-curve: This shows the actual work progress over time. It's used to compare the planned progress and identify any deviations.
- Earned Value S-curve: This shows the earned value of the project over time, which measures the value of the work completed. It's used to determine if the project is within budget.
- Cumulative Cost S-curve: This shows the cumulative cost of the project over time. It's used to track project expenses and ensure they are within budget.
Different use of an S-curve in project management
An S-curve can be a powerful tool in project management, used for more than just tracking project progress.
Below are some common use cases for S-curves in project management.
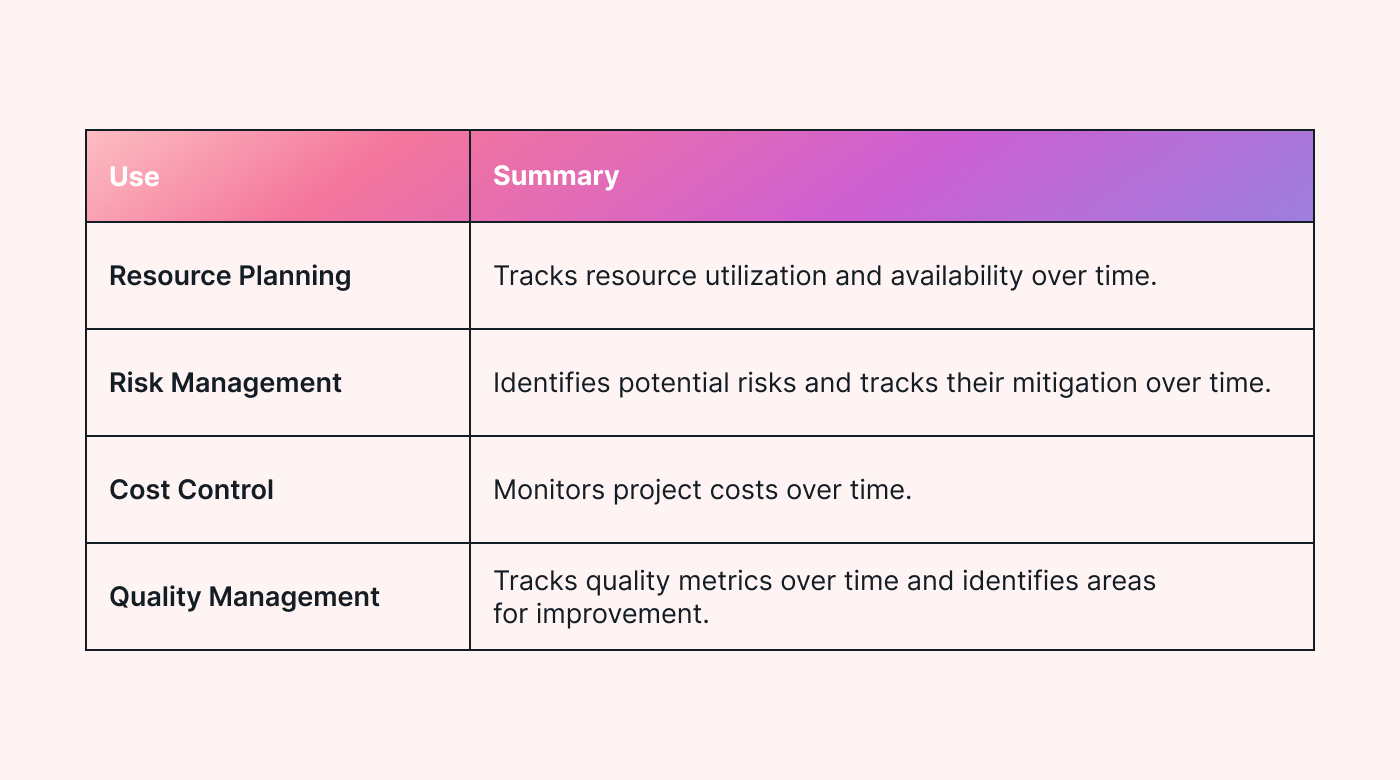 |
Next, we'll go over each of those in more detail.
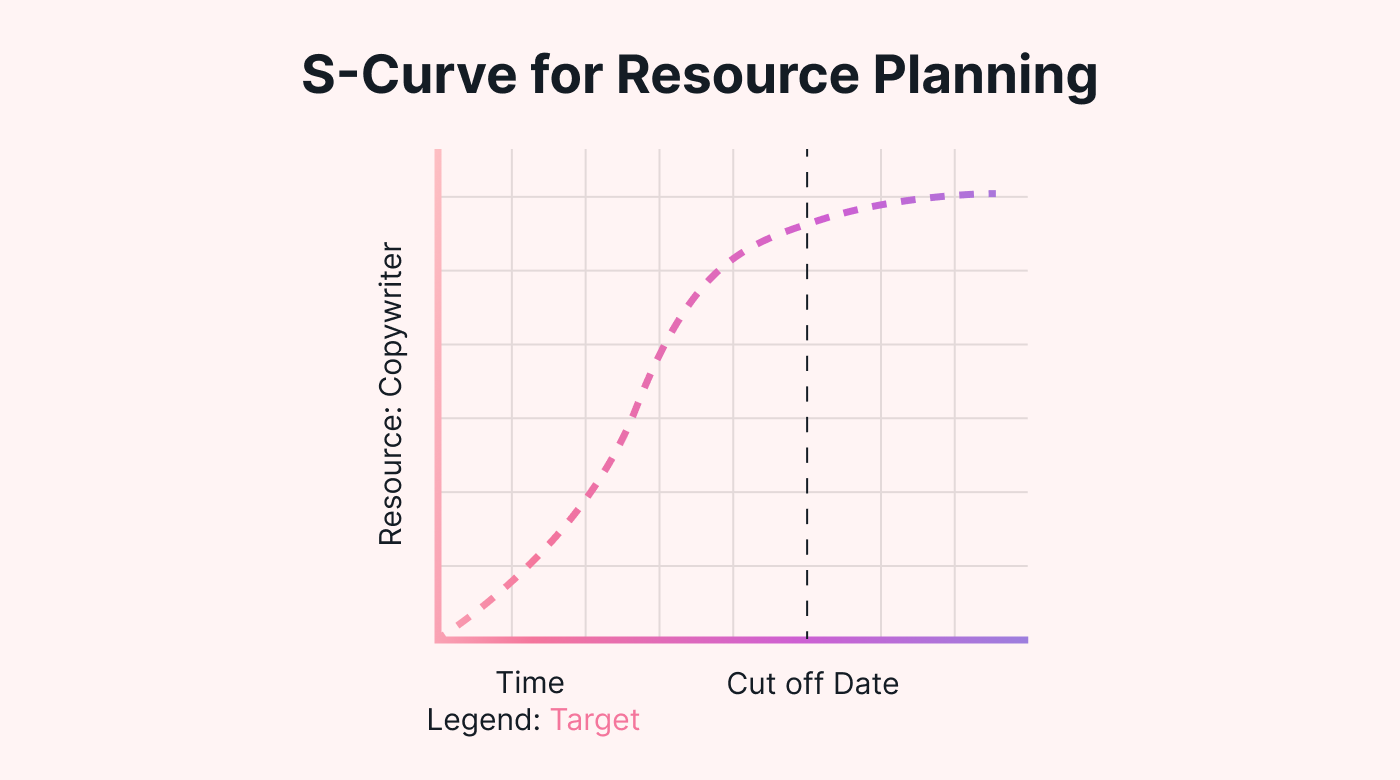
Resource planning using an S-curve
Using an S-curve for resource planning involves plotting the resources required for each project stage against time.
This allows you to see how resource demands will change over time, helping you plan and ensure you have the right resources available on time. It also avoids delays and cost overruns from resource shortages, ensuring your project stays on track.
 |
Moreover, an S-curve can help project managers detect potential resource conflicts. For instance, if the S-curve shows that multiple resources are needed at the same time, managers can reschedule tasks to ensure no conflicts. Or consider alternatives such as outsourcing or hiring additional staff.
This is just one example of how it can optimize the use of resources and minimize waste, leading to greater efficiency and cost savings.
Risk management using an S-curve
By using an S-curve for risk management, project managers can be proactive rather than reactive in identifying and managing risks. This can minimize the impact of risks on the project's progress and increase the chances of project success.
Using an S-curve for risk management involves:
- Identifying potential risks that could impact the project's progress
- Assessing their likelihood and impact
- Plotting them on the S-curve graph against time
By doing this, project managers can visualize how the likelihood and impact of each risk will change over time as the project progresses.
For example, if a risk is highly likely and impacts early in the project, project managers may want to allocate resources to mitigate it. If a risk has a low likelihood and impact late in the project, project managers may accept the risk and not allocate additional resources to mitigate it.
Cost management using an S-curve
An S-curve is used for cost management to control project expenses more effectively. This can help teams stay within budget, avoid cost overruns, and ensure the project's financial viability.
To use an S-curve for cost management, project managers first need to identify the budgeted cost for each project stage. And then plot it against time on an S-curve graph. They can then compare the actual cost incurred at each stage against the budgeted cost to identify any cost variances.
Project managers can identify trends and adjust their plans by visualizing cost performance over time.
For example, project managers may need to adjust the project schedule if the actual cost exceeds the budget at a particular stage. Alternatively, if the actual cost is lower than the budgeted cost, project managers may choose to return the unused budget to stakeholders.
Quality management using an S-curve
Project managers use S-Curves in quality management to predict the quality of the deliverables.
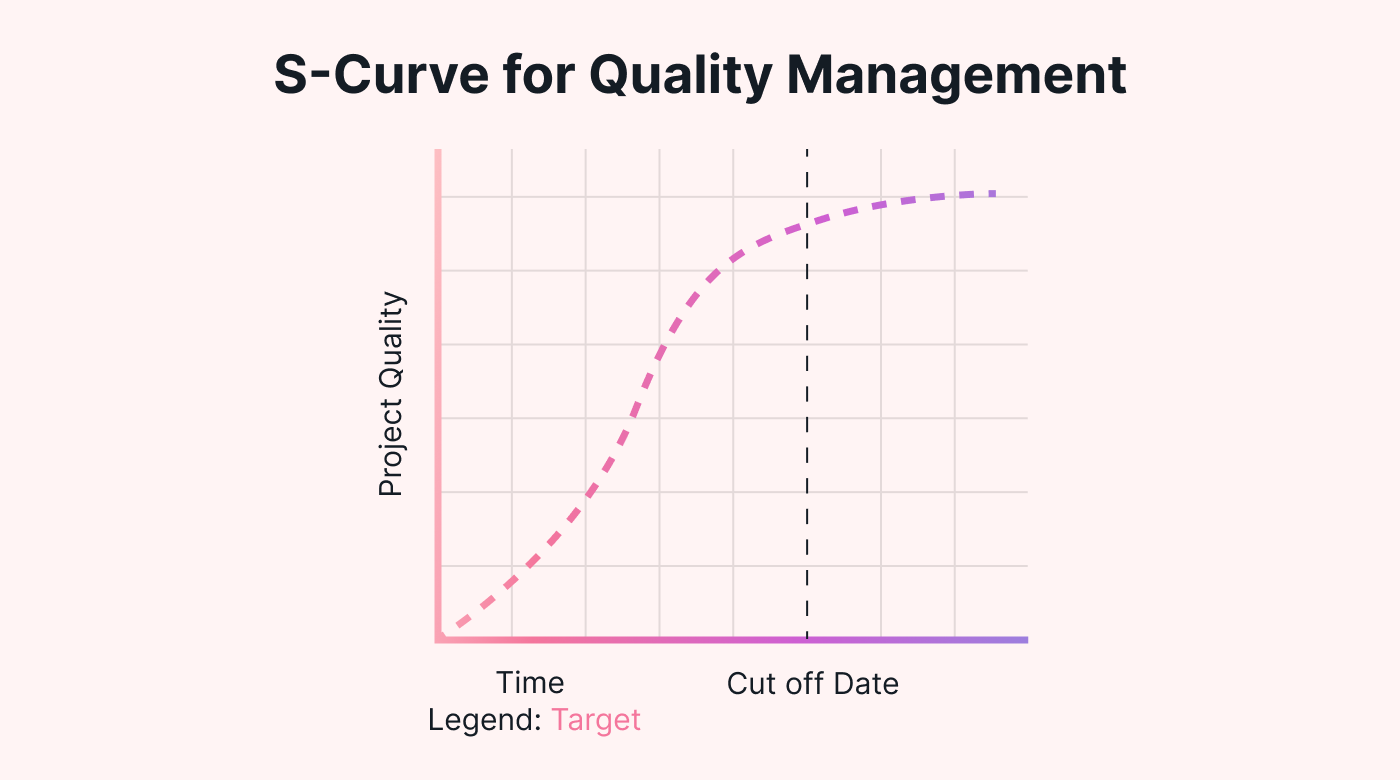 |
Using an S-curve quality management involves:
- Defining the quality metrics that will be used to measure the project deliverables
- Plotting the quality metrics on the S-curve graph against time
- Comparing the actual quality metrics to the expected metrics
By doing this, project managers can track the quality of the deliverables and take corrective action if necessary.
For example, if the actual quality metrics are below the expected metrics, project managers can identify the root cause of the issue and take corrective action. This helps ensure that the deliverables' quality meets the required standards.
Using an S-curve for quality management can also help project managers predict the quality of the deliverables at each stage of the project. Allowing them to take action before quality issues arise.
How Motion helps track and monitor progress
Motion is a powerful project management software offering faster progress tracking and monitoring.
Project managers can see how work progresses across tasks, phases, and projects using its visual progress tracking feature. The feature offers a bird's-eye view of the project timeline and highlights the areas that require attention.
Unlike traditional S-curve graphs, Motion's progress tracking feature shows real-time progress data and provides instant updates. This allows project managers to react quickly to issues and make data-driven decisions.
Additionally, it provides detailed reports on project progress and resource utilization, enabling project managers to identify trends.
S-curve summed up
The S-curve is a graphical representation of cumulative work completed versus time in a project. It has been used in various fields since the early 1900s and it can be an essential tool for project managers to monitor and control a project's progress.
By using S-curves for different aspects of project management, project managers can identify potential problems and take corrective action to get the project back on track.
If you are a project manager, consider using S-curves for resource planning, risk management, cost management, and quality management to increase the chances of project success.
To learn more about how Motion makes rapid growth easier, grab a free 7-day trial.


