You're already a proficient project manager, but as a busy professional, you always look for ways to optimize your processes and improve project outcomes for your organization and team.
Did you know that a 2022 study showed that only 67% of organizations reported completing more than half of their projects on time, and only 74% reported completing more than half of them on budget?
With the number of meetings and ideas at the start of a new project and so much pressure to kick off, it’s easy to see why planning , the most important phase of the project management lifecycle, can be skimmed over.
This article will show you how to leverage PERT charts in the project planning stage to ensure that all tasks and deadlines are accounted for and that an accurate project timeline can be established.
What is a PERT chart?
Before we jump into how PERT charts can level up your project planning, let's look at what a PERT chart is. PERT stands for Program and Evaluation Review Technique. It is a practical project management tool for visually mapping out detail. It was created in the 1950s by the United States Navy to manage complex projects across large teams.
PERT charts provide a visual means of scoping a project in the planning phase, including all milestones, task dependencies, and expected timelines to complete the project. This visual representation allows for a calculable, visible path, also known as the critical path. The critical path is the longest path through the project tasks, and thus provides an estimated duration of the project from start to finish.
PERT calculations are different from those in the Critical Path Method (CPM) but they are both ways to estimate task and project durations.
Using the critical path method, you can visually highlight the essential tasks that must be completed for the project to be delivered by the deadline, providing easy communication to stakeholders.
PERT charts offer a freeform style of charting that's extremely flexible for planning a project. It's especially useful when the project is highly complex with multiple task dependencies and departments or teams to consider.
PERT vs. Gantt: What’s the difference? (With examples)
PERT and Gantt charts allow project managers to outline tasks meaningfully, but there are distinct differences between how they work and when they are used. Let's look at this in more detail:
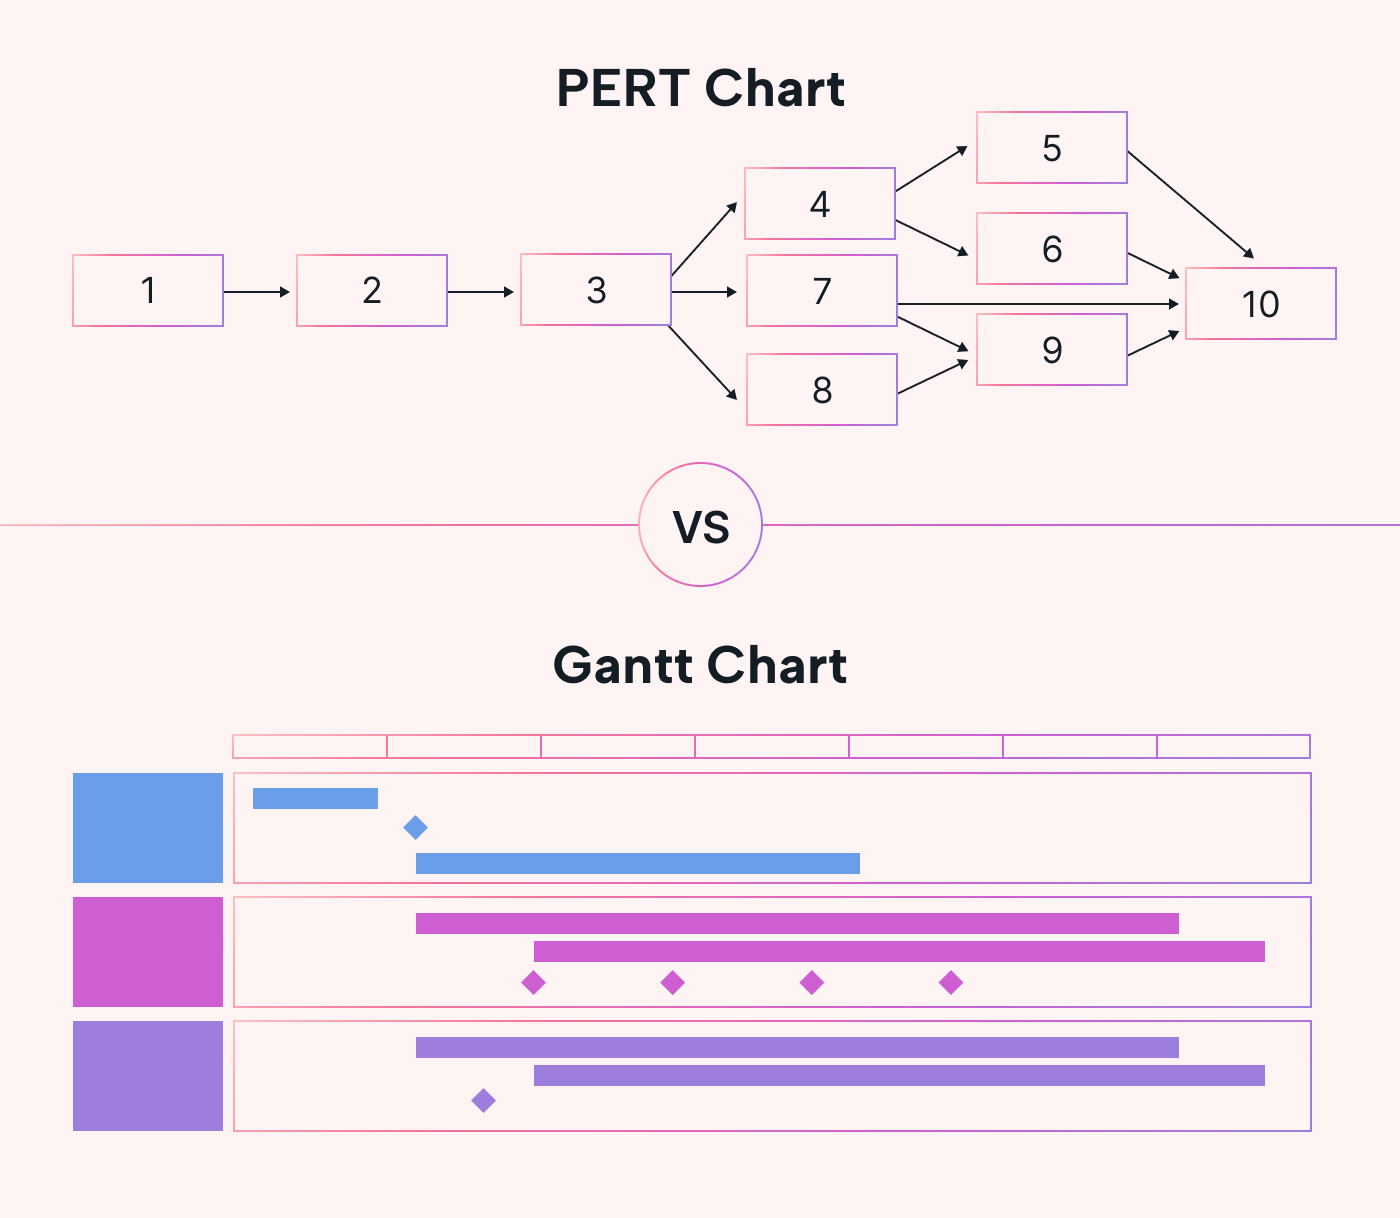 |
PERT Charts
- More useful in the planning phase of a project
- Provide a high-level visual overview of tasks and key project milestones
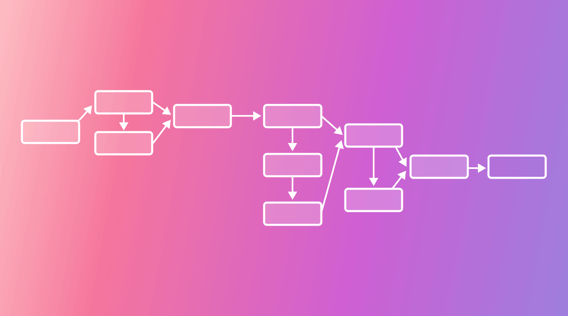
- Use a network diagram to display tasks on a visual map
- Outline the entire scope of a project in a fixed visual
- Used to create a timeline of your entire project before kick-off
- Also used to evaluate a project in progress and review it once completed
Gantt Charts
- More useful once a project is underway in the execution phase
- Provide a detailed and dynamic visual management tool to track progress
- Use a linear style to display tasks on a bar chart representing timelines
- Outline project scope but is flexible as scope changes
- Used to track the ongoing status of milestones and break them into manageable tasks
- Used to manage a project in progress
Why use a PERT chart to pre-plan projects?
The visual structure of a network diagram allows for high-level clarity for all stakeholders when planning complex projects.
You wouldn’t just put your ideas into an unstructured document without charting all milestones and timelines.
Instead, you’d want to be able to visualize and communicate clearly:
- How tasks relate to each other in order of task dependency
- How to identify avoidable roadblocks in advance
- Where effective contingencies will be necessary because you have a clear understanding of all tasks and dependencies
- A reliably estimated completion date that's been calculated with confidence
These are just some ways a PERT chart can streamline your project planning.
Another key benefit of mapping out project tasks and relationships is how it unites teams around a common outcome.
Working as a team, map out tasks and dependencies based on the experience team members have in their individual roles and departments.
A web designer will have a better understanding of the task dependencies in their department than a copywriter will, and vice versa. This process makes team members accountable for identifying issues and contingencies in advance and makes it easier to take ownership of tasks during project execution.
How PERT and Gantt charts complement each other
We’ve highlighted some key differences between PERT and Gantt charts, but how are they similar?
PERT visually represents all tasks with durations, while the Gantt chart lays tasks along a calendar timeline. While they are different, they influence each other. Your PERT chart is a planning tool to create a Gantt chart, a dynamic representation of real-time project status.
If you use the PERT method effectively, creating your Gantt chart or Kanban boards will be much easier and more accurate as you have already effectively outlined all tasks, dependencies, and timelines with proven calculation methods such as optimistic, most likely, and pessimistic times.
By using both, representing similar data in different ways, team members can easily find clarity in what they are working on and when it’s due.
If the team is involved in the project from planning through execution to delivery, they’re more attuned to the schedule than if they had just received their tasks when the project was already underway.
As your team executes the project, your Gantt chart will be regularly used to manage your team’s schedule and chart task progress. Your PERT chart can act as a guidepost to evaluate timelines and will be revisited if scope changes need to be introduced.
Using PERT and Gantt charts together makes milestones clear from the outset and can be referenced throughout project execution.
PERT Chart: How to create one - with examples
Now that you understand how PERT charts contribute to project management, why not create one? Here's how:
Step One: Identify project activities and milestones
The main goal of this step is to understand the key deliverables and milestones that must be executed during the project (what is the scope?) and to break it down into a Work Breakdown Structure (WBS). Examples of a WBS include a list or a mind map of what needs to be delivered.
Pro-Tip: Here, we are looking to chart the project's key deliverables to get high-level visualization and clarity.
Step Two: Identify the tasks required to create the deliverables
The purpose of this step is to examine the WBS and identify the tasks needed to create each deliverable in the WBS. This might mean further breaking down the WBS elements to get clarity on which tasks will be needed to produce them.
Step Three: Determine the proper sequence of project tasks
Now that you know all the tasks, determine the task dependencies. Which tasks are dependent on others to be completed?
List tasks in order of dependency so they can be easily transferred to your network diagram in the next step.
Step Four: Construct your network diagram
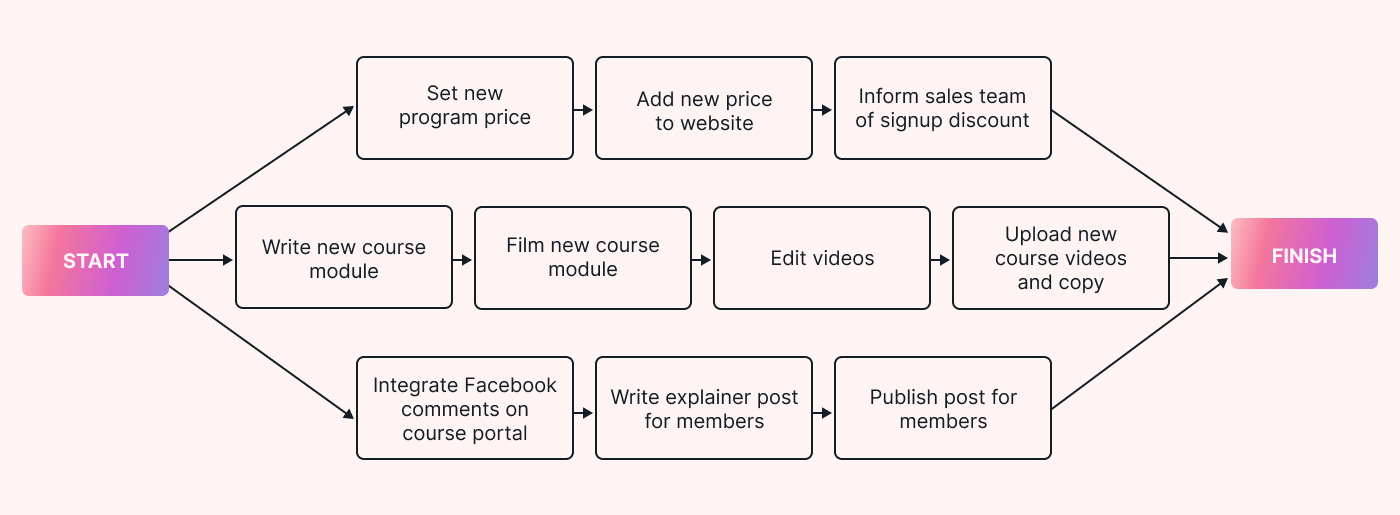
Draw a network diagram with activities sequenced in the correct order that they need to be completed. See an example of this in the image below.
Note: Once the network is drawn, ensure that the nodes are in the correct order to execute the tasks. This may take more than one attempt as you reorder your nodes.
 |
Step Five: Estimate the time required for each activity
Now comes the fun part!
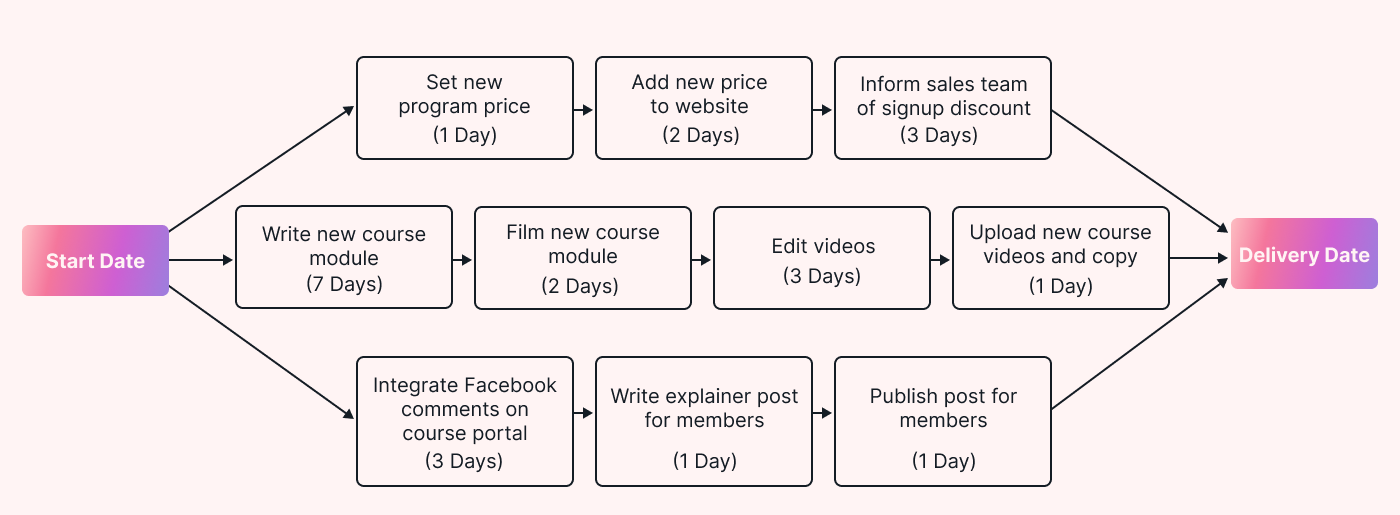
Calculate the expected durations for each task using the PERT formula, which asks you to state an optimistic time, most likely time, and pessimistic time project duration. Once you have these times figured out, you can plug them into this formula to get your expected time.
Expected Time = (Optimistic + 4 x Most Likely + Pessimistic) / 6
Note: You may want to add milestones to your chart, which are tasks with no (or zero) duration, but that represent major achievements, such as completing a group of related tasks to build a main deliverable to provide context between tasks.
 |
Step Six: Determine the critical path to project success
Now that you’ve done your individual task calculation, you can add the estimates of your tasks from start to finish. Following the possible paths, you can find the longest path from project start to finish. This gives you an estimated project duration known as the critical path.
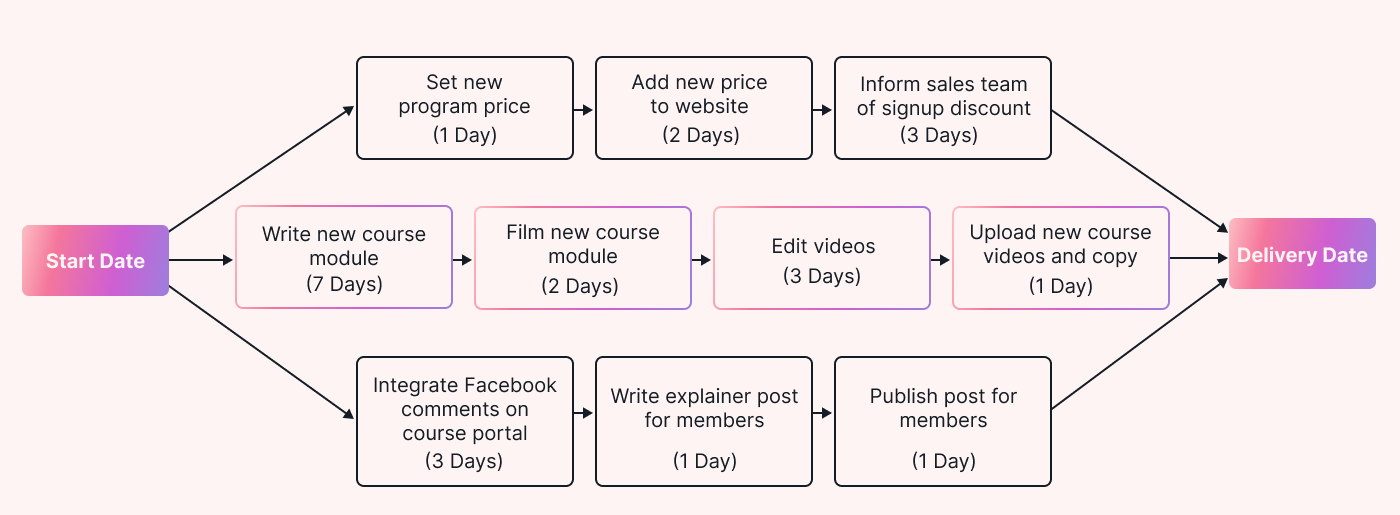 |
You can highlight your critical path in a different color from the rest of your network diagram so it’s clearly visible on your chart, like in this example. The critical path is 13 days long (the longest path), as you can see by adding the durations in the pink-outlined boxes.
Step Seven: Regularly update your PERT chart as the project progresses
Now that you have your chart, it's critical for your team to reflect on the diagram and timelines and agree that it accurately reflects the project and how it'll be managed.
Be sure to update your PERT chart regularly to reflect any changes in the scope or timelines so that the project can be evaluated accurately on completion.
Pro tip: Why not use a PERT chart template to simplify these steps? There are plenty of readily available tools like Google Sheets and Microsoft Excel.
Using PERT tasks with Motion
PERT charts can help you to define the tasks that need to be managed. Once defined, you can enter these tasks into Motion’s Intelligent Calendar. You can then assign them to your team members in Motion and manage them there with all the additional features that Motion offers.
Inputting PERT tasks into project management software
Now that tasks are clearly defined, they can be assigned and tracked with Motion. Assign tasks to team members automatically as the task parameters have already been agreed on. Motion can track progress on these tasks and manage your team’s activities according to their priorities.
You can also automatically add tasks to your team members' calendars for seamless workflow, set start and completion dates, and track your milestones in multiple views depending on how your team best visualizes data.
Additionally, attach your PERT chart as a project document so it is centrally available for the team to access as needed. This gives you an easy-to-access debriefing tool as your PERT chart, compared with the tracked history of the project in Motion, which can also be used to stay on track and track progress.
Pairing your completed PERT chart with Motion’s Intelligent Calendar gives you an excellent start in assigning and managing your team’s tasks.


