Perfectly managing a project and predicting all obstacles is impossible.
Case in point — in 2021, only 73% of projects met their goals, only 62% of projects did so within the planned project budget, and 55% finished by their planned timeline. And this survey is from project managers in mostly large, experienced organizations. If we asked SMBs and mom-and-pop shops, the numbers would probably look even more depressing.
So what can you do about it? How do you ensure that the crucial projects you’re tackling finish on time? You need a way to track when things are going wrong ASAP and accurately course-correct.
Enter earned value management, a project management method that can help you do exactly that. In this article, we’ll break down exactly what earned value management is, its moving parts and benefits, and how you can leverage the method to finish your project on time and within budget.
What is earned value management?
Earned value management is a project management method that estimates project performance and progress by comparing scope, cost, and time spent against your estimated timeline and budgeted expenses.
In simpler terms, you measure and determine various data points and compare them to the progress you should have made in the project if everything went according to plan.
For example, if your timeline was 4 weeks, and you’re now 2 weeks in, you should be halfway through the project. An EVM analysis might show that you’re only 25% of the way there, which helps you adapt your approach to try to finish the project on time.
This analysis technique is a powerful tool to have in your project management toolbox.
Benefits of earned value management
If you’re not quite on board yet, let’s explore the core benefits of earned value management.
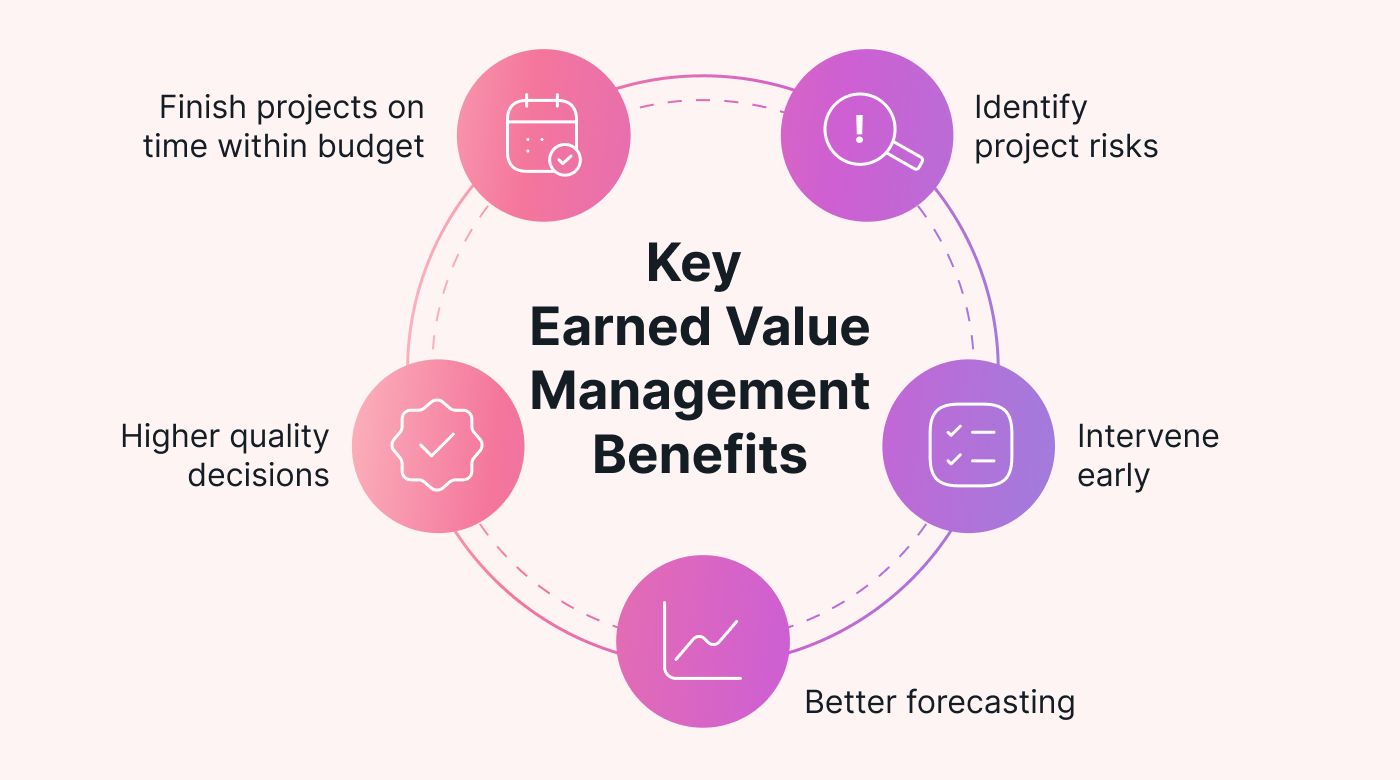 |
Helps you identify key project risks
No project ever goes 100% according to plan. Mike Tyson famously said, “Everyone has a plan until they get punched in the mouth.” And this is equally applicable to business.
When you first create a timeline for renovating your office, it’s almost impossible to foresee every potential issue that can cause delays, like a stubborn landlord or city official that keeps rejecting your proposed layouts.
Doing an EVM analysis helps you identify key areas that are taking longer than they should, which put the entire project at risk.
Chance to intervene in projects early
With risks identified, you can get ahead of the damage and intervene early in the process, taking steps to make sure it doesn’t interfere with the project’s timeline or budget.
For example, take initiative and get clear with the city official on what’s needed to approve the building plans. Clearing roadblocks like this can help get your project back on track.
Better forecasting of results, timelines, and costs
The detailed analysis of actual progress, costs, and effort leads to more accurate forecasting of costs, project timeline, and even the final results.
The benchmark for reliable EVM analysis is when the project is around 20% completed, backed up by decades of DoD and US Air Force research (from 1977–2014), and typically adopted by most PM professionals today.
Make better project decisions with access to higher-quality data
Decisions related to the scope or direction of the project have big ramifications and should be based on data and experience, not guesswork.
A larger focus on data-based decision-making is one of the main reasons Agile has grown in popularity over the last few decades. But EVM works just as well with the waterfall methodology where you might have a strict work breakdown structure (WBS).
For example, after reviewing the work that’s been done to renew your website, you realize that narrowing the focus to the most important pages would be a more manageable project scope while still delivering 90% of the value.
Helps you finish more projects on time and within budget
The project baseline and EVM analysis help you figure out the real state of your project, even during the early stages. By identifying key risks, solving them, and adjusting your processes, scope, and goals, you’ll ultimately finish more projects on time and within the project budget.
Now that you understand why to use EVM let’s dive into the how.
The moving parts of earned value management
Earned value management relies on a wide range of data points and formulas to help you get the real picture of your current project status. Below, we explain the most important ones and give examples.
 |
Actual cost (AC)
AC simply represents the actual costs and work hours expended to reach the current point. For example, all expenses and work hours spent for the office renovation (up until this point).
Planned value (PV)
Planned value is (in simple terms) where you expected the project to be.
20% into the timeline and budget for a renovation project, for example, you probably planned to be in the building stage.
Earned value (EV)
Earned value, on the other hand, is where you actually are in the project lifecycle.
For example, after 20% of planned effort in the renovation project, you’re still arguing with city officials in the planning stage.
Variance analysis
Variance analysis is the process of comparing earned value versus planned value and actual costs.
 |
Getting the expense numbers (to date) from accounting, tallying working hours, and then comparing the two using the formulas below.
Schedule variance
Schedule variance is the quantified difference between EV and PV in a project’s schedule and progress.
For example, you expected to shut down the office for renovation two weeks ago, but that’s still at least two weeks out.
Cost variance
The cost variance is the difference between expected costs at this point in the project and the actual costs.
For example, you’ve spent an additional $3,000 on drawings from the architect because of requested changes from the city officials.
Schedule performance index
You calculate the schedule performance index by dividing your earned value by your planned value.
For example, if you’re two weeks delayed on a renovation project that should be 8 weeks long, your SPI would be 2, indicating that you’re en route to a twice-as-long project timeline.
Cost performance index
To calculate the cost performance index, divide your earned value by actual costs.
For example, if you’ve spent $8,000 instead of $5,000 to get to the current stage, that indicates you’ll spend 1.6 times your total budget if this keeps up.
Budget at completion
Budget at completion is the total sum of all your different budgeted expenses, from materials and contractors to payroll. Simply tally everything up to get this number.
Estimate at completion
There are a number of ways to calculate an estimate for completion, but typically you add the actual costs to the planned value multiplied by your cost performance index.
For example, if you’ve spent $3,000 extra on architectural drawings, that will be added to your initial estimate for actually implementing the renovations.
The EAC calculates your total project costs expecting similar issues later in the project. So if you’ve spent $13,000 instead of $10,000 30% through a $50,000 project, the EAC would be $65,000.
The calculation looks like this: $13,000 + ($40,000 x 1.3)
We know that there are a lot of different metrics to work with, so up next, we’ll dive in and cover how to do an earned value analysis for a real project.
How to calculate earned value for a real project
Let’s walk through another, different, example to calculate earned value metrics.
Here’s a basic outline of a hypothetical website redesign project:
- An 8-week time period
- 400 planned working hours across five key task categories
- A budget of $15,000
- Analysis at 50% completion milestone
Break down your project into clear tasks, milestones, and costs
Before you can actually use EVM effectively, you need a clearly defined project where you can accurately measure and define processes in different stages.
The best way to do this is to follow the critical path method. This will help you define your tasks and stages, and help you plot the optimal path for the project (and how long that will take).
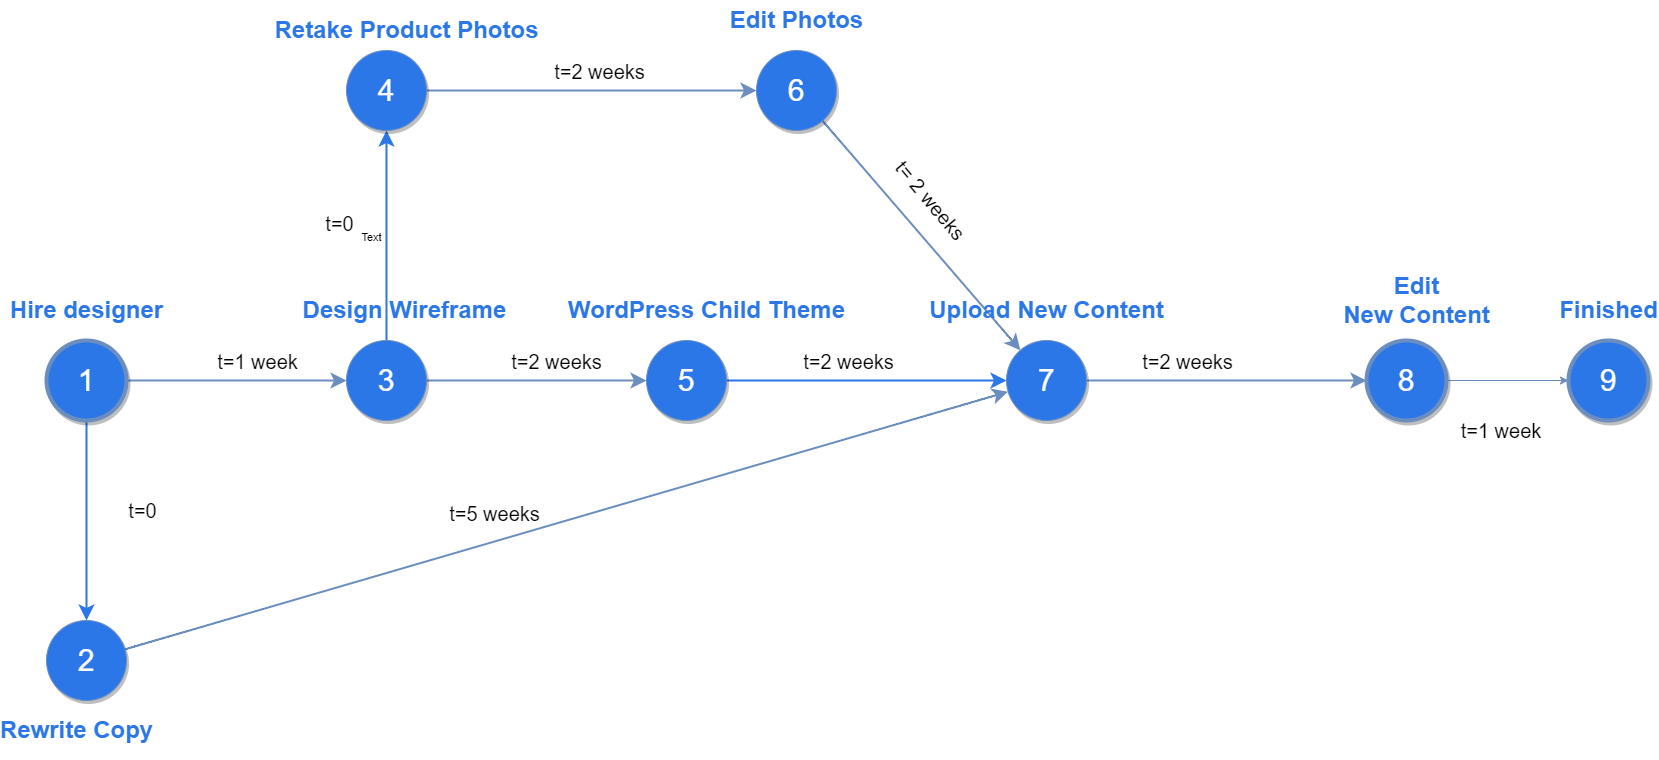
For example, you might end up with something like this, which breaks down a company website revamp project into different (dependent) tasks, to create a critical path:
 |
Then you can create what project managers poetically call the project’s “performance measurement baseline” (key word is baseline). To do so, you’ll need to map out the cost and timeline benchmarks that you will later use for comparison. (Read the project management institute’s definition for more information.)
For example, the table below breaks down the critical path and defines the expected cost and timeline for each stage of our example project.
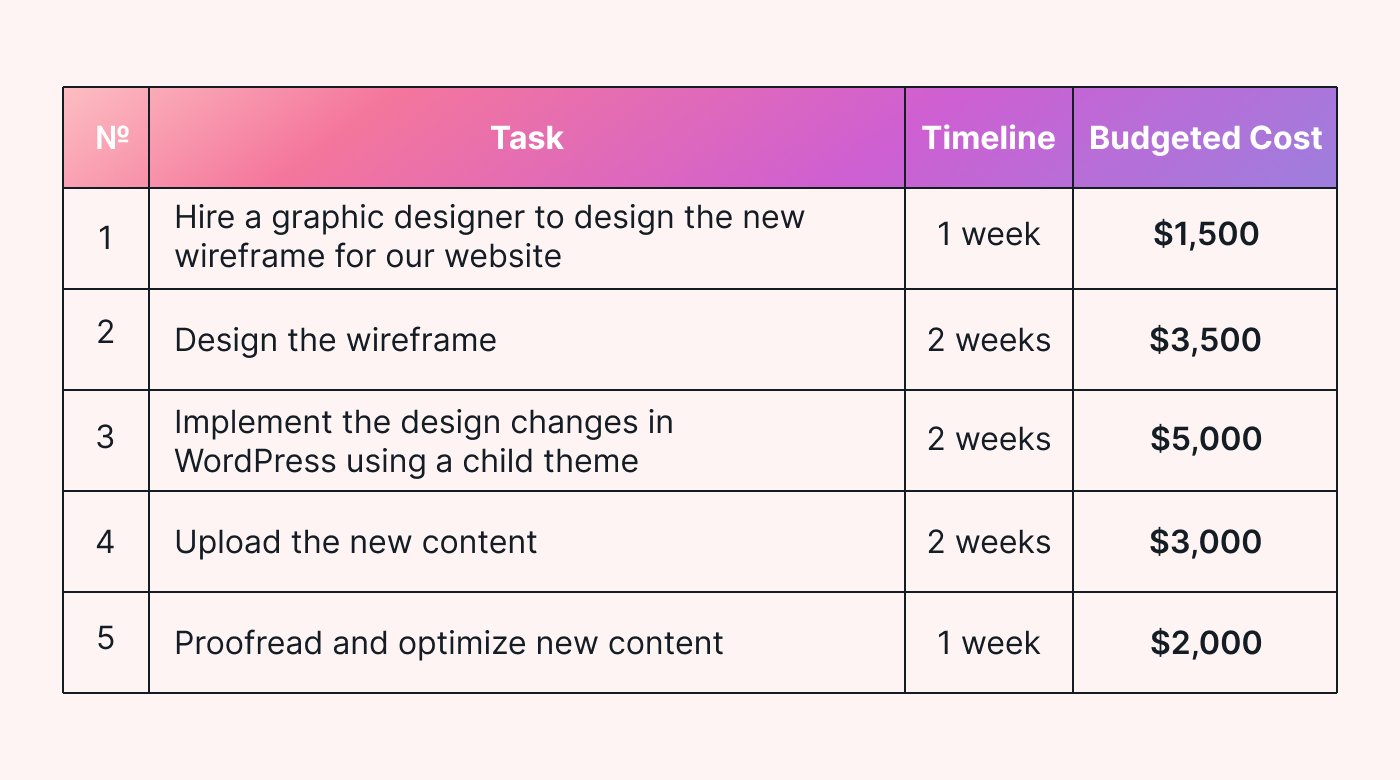 |
Notice that the copywriting stage is not included here, as it can happen concurrently with stages 1-3. The same goes for redesigning graphics and retaking office and product photos.
The critical path is all about figuring out dependencies — which tasks you cannot start without first completing another. The longest chain of dependent tasks is your critical path.
Perform the analysis when you reach the 20% complete mark
Even if you have a clearly defined project, you can’t just do an EVM analysis off the bat. You need to wait until you’ve reached at least the 20% stage if you want any form of accurate results.
Input your project baseline - budget, hours spent, expenses, and progress
Start by inputting the budgeted cost (including payroll) for each of the tasks. The planned value of your project is essentially the budgeted costs for each stage of your work breakdown structure.
In this case, we would be inputting something like $1,500 for the first week of Task 1, $1,750 for the second week in Task 1, and so on, based on our estimate of how much we expect to pay for each time period in each task.
This is your baseline, which you will then compare your actual project costs and performance with.
Input earned value and actual costs and calculate the performance variance
Next, it’s time to calculate the cumulative earned value by simply inputting how much of your project tasks you’ve actually finished at this stage.
In this case, we’re 4 weeks into the project. Let’s say we’ve just finished the wireframe design and gotten about 40% of the way through implementing the new design for our fictional company WordPress site.
That means we have to quantify the level of progress for each task, for example, the wireframe design was halfway done after week 1, and 100% done after week 2.
Up next, all we need to input are our actual costs, and you can calculate the rest using the formulas above (or rely on a template to do the work for you.)
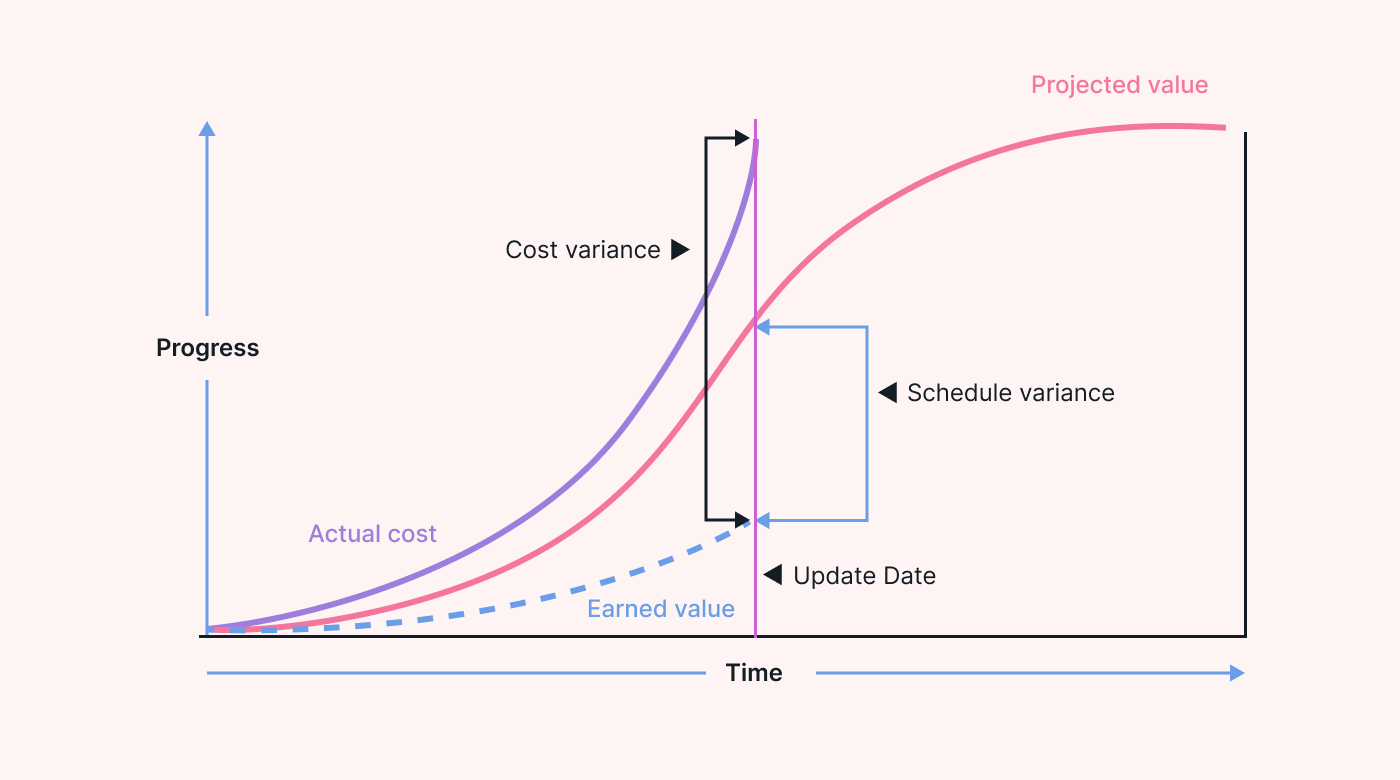
This will allow you to create a graph where you can compare earned value and actual costs to the planned value. Since we’re 40% of the way done, but slightly behind schedule and have spent more than the budget, the earned value analysis graph will look like this:
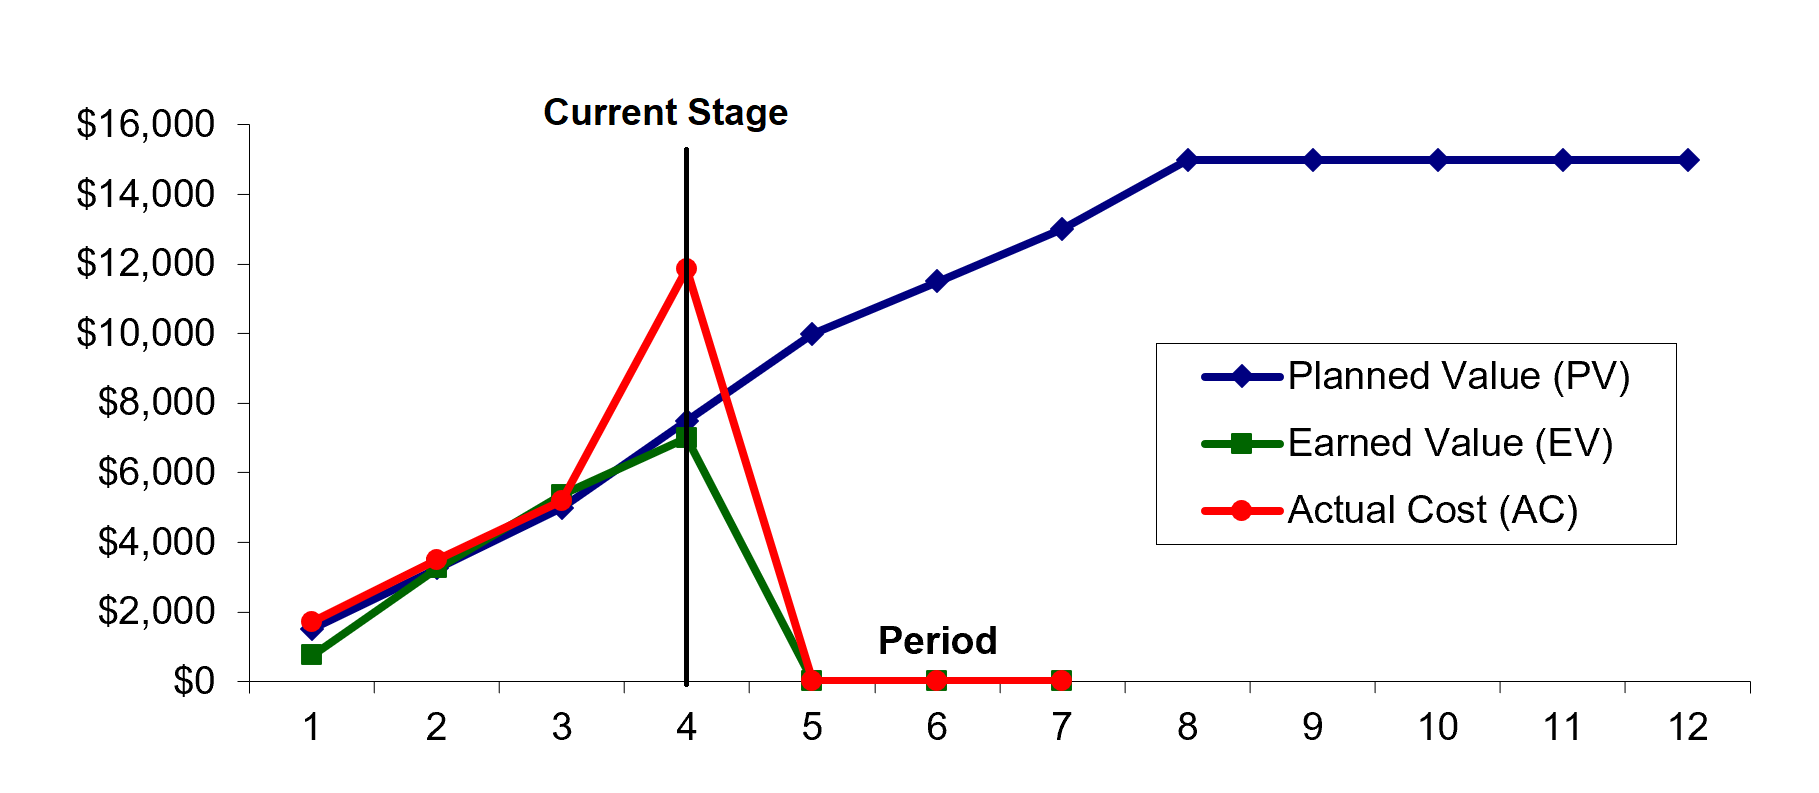 |
This helps us visualize that the actual costs have ballooned much faster than expected, but that that project is doing quite well schedule-wise.
After this, we can calculate a variance analysis that helps us forecast the costs and performance of the rest of the project.
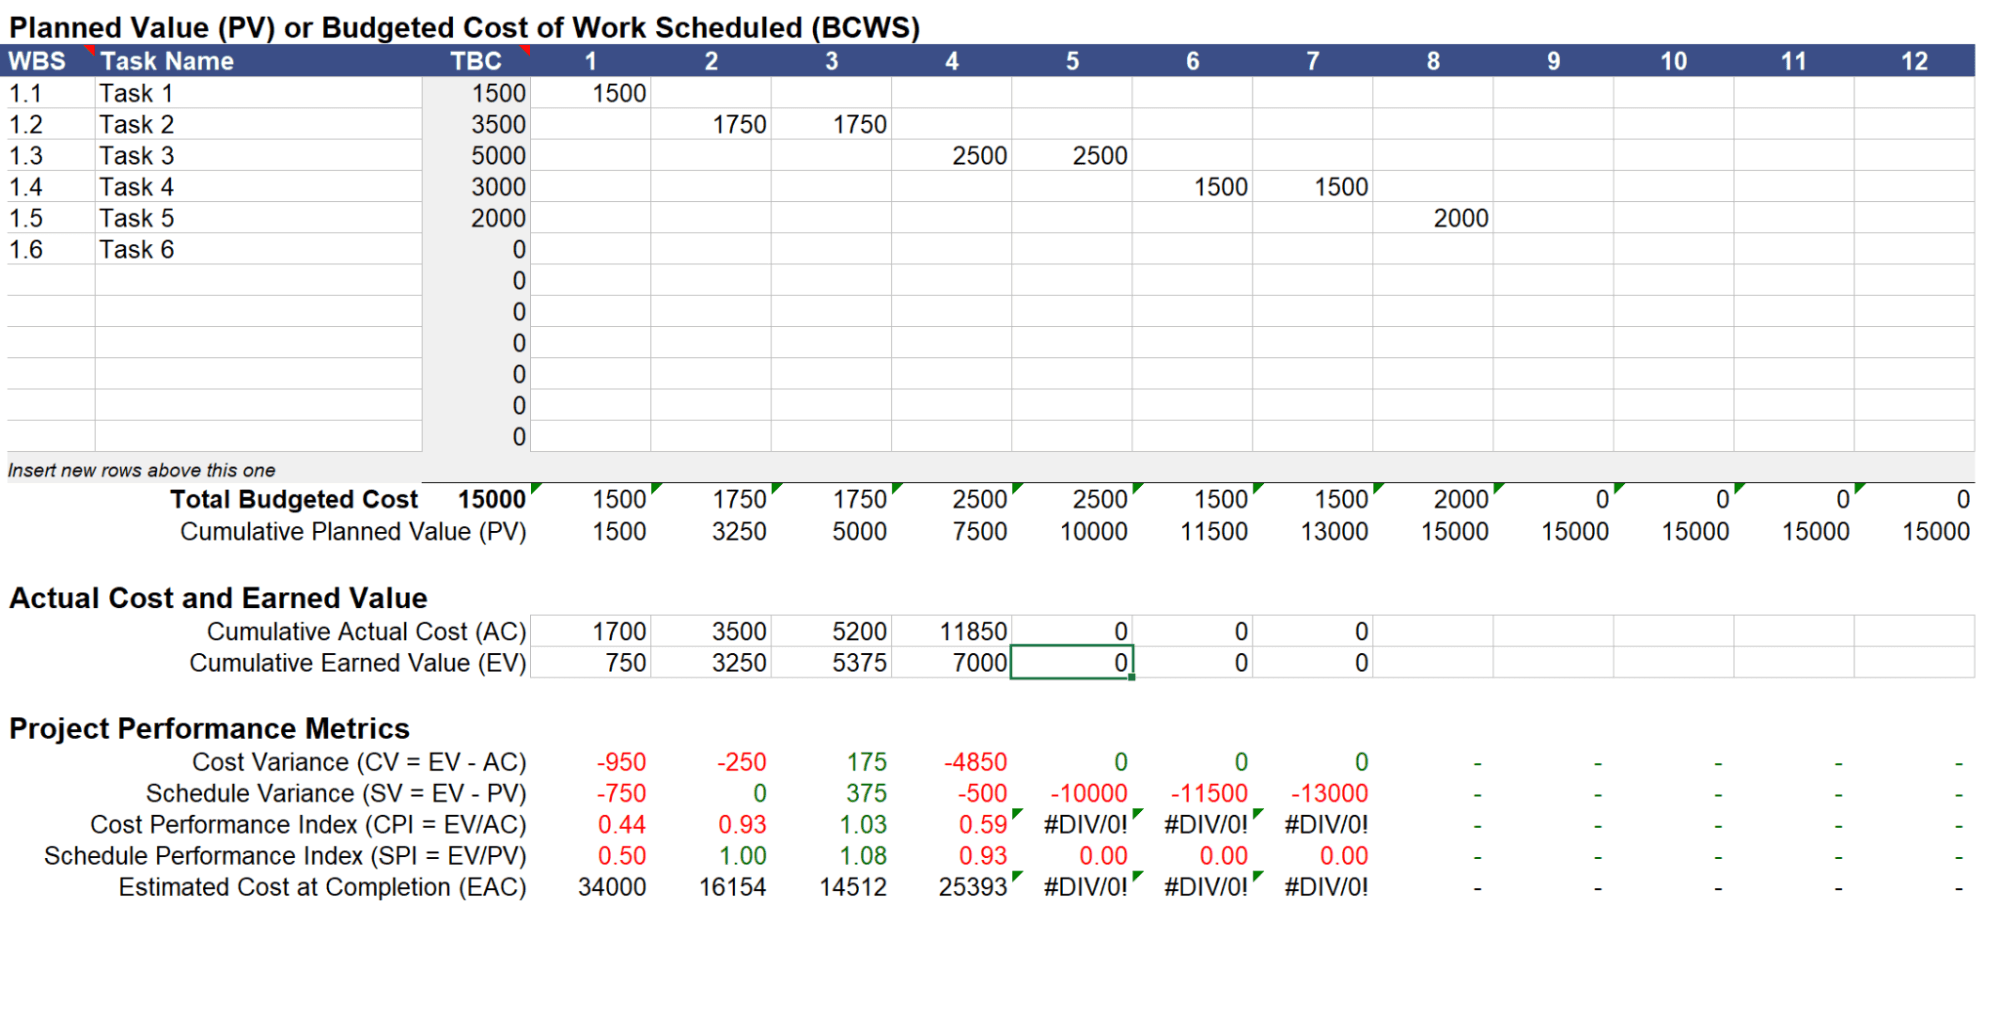 |
The above is an example of what project performance and variance metrics look like when calculated at each stage (in this case, by weeks) of a project. Notice how much the estimated cost of completion fluctuates in the early stages in the project.
If you find budget or scheduling issues, plan interventions
The last step in an EVM analysis is to quickly transition into intervention mode if you find any significant issues.
For example, schedule-wise, it looks like we’re pretty on point here. But after we initiated the development phase, we can see the costs have ballooned completely out of control. According to the EAC, if it keeps going at this rate, we’re going to spend over $25,000 on a project budgeted for $15,000.
Potential interventions include reducing the scope of the design, or hiring an additional, cheaper developer to help complete the project (at a lower cost).
EVM is only the first step towards keeping deadlines and meeting goals
If you’ve only just started managing large-scale projects, earned value management can feel daunting, but it’s a great tool to help you adjust and help your projects succeed.
What it doesn’t help you do, however, is fix the problems that you discover. One of the most common issues in projects is simple milestone or schedule drift — when projects are delayed simply because key employees don’t find the time to work on the project.
We’ve been working hard on a solution to this problem. Motion for Teams automatically schedules work for your employees or teammates using AI, following pre-set rules and priorities that you define.
It natively integrates with both Google and Microsoft calendars, so none of your teammates have to switch away from their calendars of choice.
If you finished your EVM analysis and noticed that your project team is lagging, why don’t you give Motion a try for free? Automated scheduling and task organization can help your project team get work done on a daily basis.


