
Project estimation is hard.
In fact, 45% of projects fail to meet the deadline. 37% never complete within budget and 34% of projects experience scope creep.
That’s where user story points come in.
As the famous agile saying goes, “Stop starting, start finishing.” Story points help you achieve that by estimating projects the right way.
It takes the guesswork out of the equation by calculating complexity, size, and risks from the developers’ perspective.
In this article, we’ll go over the essentials of agile story points, its principles, ways of calculation, common pitfalls, and more.
So, if you’re struggling with project estimation, this guide is for you.
What are agile story points?
Story points are a unit of measurement for sizing up the relative complexity and size of a user story or task. Think of them as a multidimensional yardstick that gauges more than just time — it assesses effort, risk, and uncertainty.
You might be thinking: Why not just clock the hours?
Because when estimating a project, time alone falls short. It can't account for variables like risk and skill level. Story points fill that gap, offering a multidimensional view of work complexity.
Think about it. Is an hour spent solving complex algorithms the same as an hour spent filling out forms? Not really, right? Story points offer a more comprehensive understanding of the task at hand.
Assigning story points isn’t a random act, either. Four key factors contribute to these numbers:
- Scope and Clarity: Ambiguous requirements can be a point inflator.
- Team Expertise: A seasoned agile team might find a task less complex than a rookie squad.
- Resource Availability: Got all the tools you need? If not, add a couple of points.
- Project Constraints: Interdependencies can be a drag on your point estimates.
These elements contribute to the weight of your story points, offering a rounded perspective for more accurate planning and allocation of tasks.
How to create user stories
Creating a user story isn’t as complex as solving a Rubik’s Cube but requires thoughtfulness. Here are the steps to help you master user story creation.
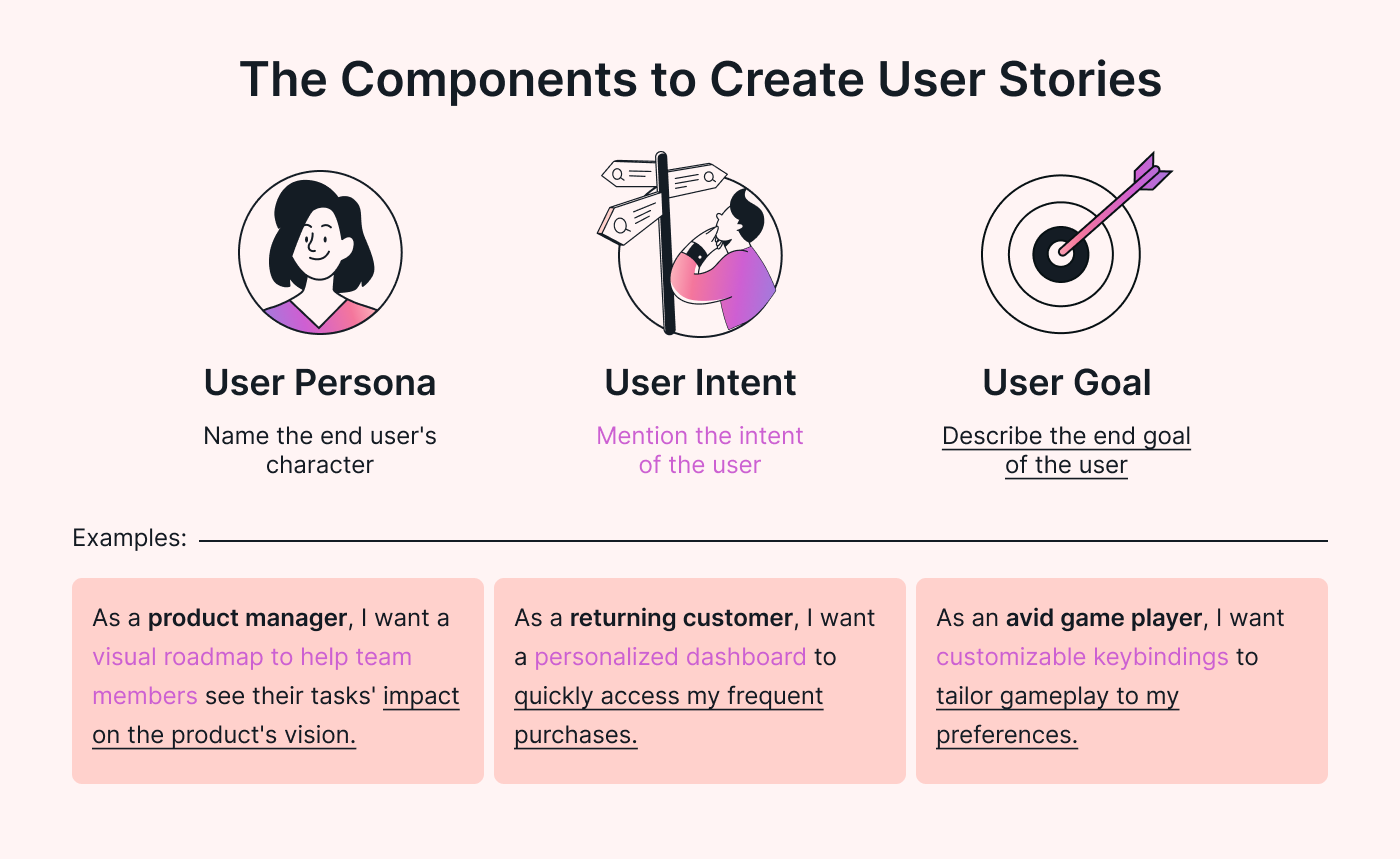
Define the type of user: This step answers the question, “Who are we building this for?” Knowing your user is critical. We’re not just talking about a vague category but a fleshed-out archetype of your target user.
Identify user intent: What does the user want to accomplish? Here’s where your team’s problem-solving abilities shine. Identify the core actions the user needs to achieve their goal.
Pinpoint the goal: Why does the user want this feature or action? This step helps in focusing development work on what delivers value. If you can’t nail this down, reconsider whether the story is worth pursuing.
Got all the above points sorted? Now, use this template to assemble your user story:
“As a <define the type of user>, I want to <mention the intent of the user> so that <set the goal of the story>.”
 |
This simple template brings clarity and focus to your project from the start.
Key agile story estimation principles
This is the most crucial part of this guide. Here, we’ll break down the core principles of user stories. If you grasp them, implementing user story points in your project will be a walk in the park.
Story points vs. time-based estimation
As we’ve discussed earlier, story points are a relative measure that estimates the complexity of a user story in comparison to others. Time-based estimates, however, are an absolute measure, pinpointing the exact duration required to complete a task.
The key difference? Story points give you a landscape view, while time estimates give you just a snapshot.
Story points account for the team's seniority and skill level, uncertainty, risk, and variability that are par for the course in software development. On the flip side, time-based estimates are more prone to inaccuracies. They can lead you into the tricky terrain of errors, biases, and unanticipated changes.
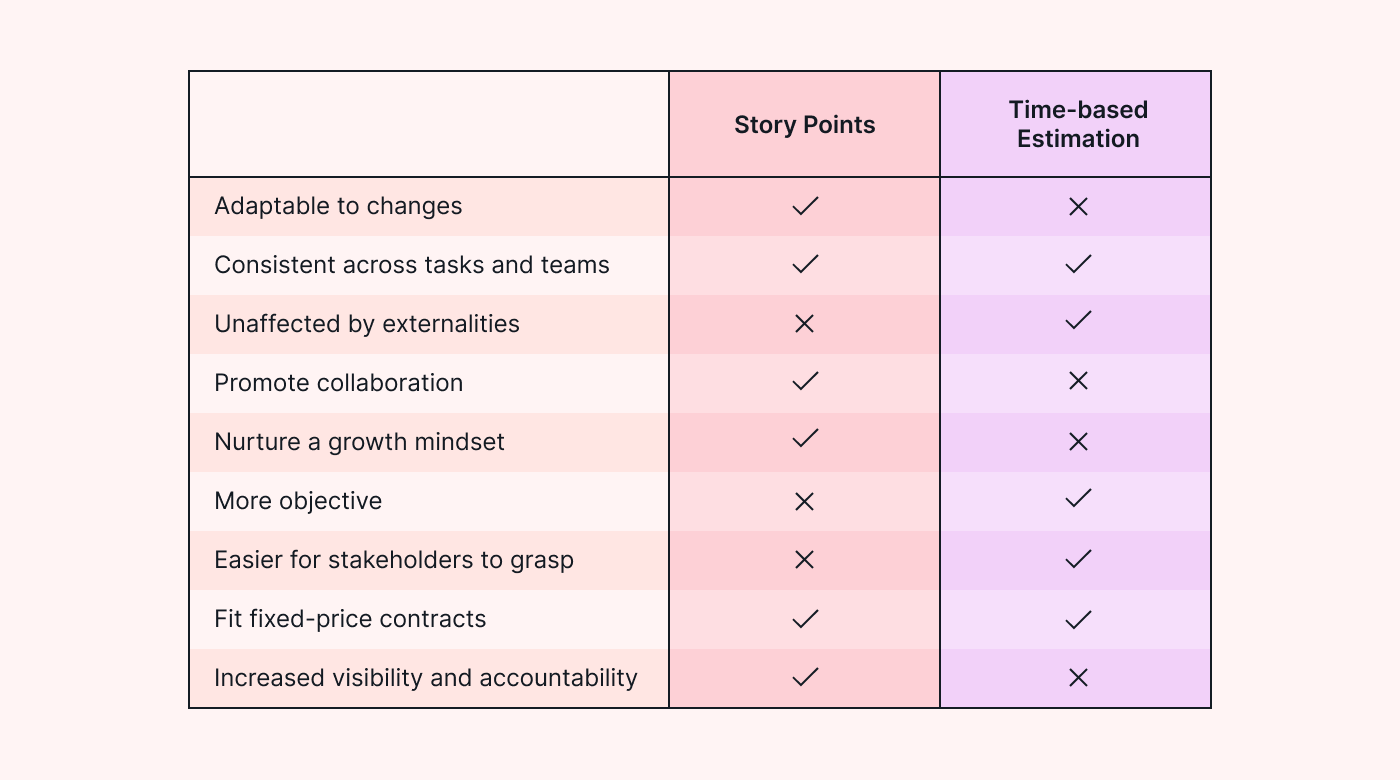 |
While time estimates are best suited for less-variable landscapes, we use story points because they give you a rounded, collective, and agile-friendly scoring system that aligns your entire team.
The planning poker technique
So, you've got your user stories, but how do you assign story points to them? Enter planning poker, a unanimous, fun way to assign story points. Teams use a deck of cards with Fibonacci numbers like 1, 2, 3, 5, 8, 13, 21, and so on.
Why Fibonacci? It captures the essence of uncertainty: the bigger the story, the hazier the estimate. Each number is the sum of the two preceding numbers, and this progression helps tackle the increasing uncertainty of larger tasks.
For instance, a user story estimated at 4 points is considered twice as difficult as one estimated at 2 points.
Let's break down how this card game works:
- Each member gets cards: Team members get cards with Fibonacci numbers.
- User story presentation: The user story or task is read aloud.
- Card selection: Team members pick a card that represents their estimate of how many story points the user story deserves.
- Reveal and discuss: Everyone shows their cards simultaneously. If there are outliers, discussion ensues to understand the reasoning behind each estimate.
- Reach consensus: The team agrees on a single estimate, and the process is repeated for the next user story.
Planning poker doesn’t just help you assign story points to user stories. It's a technique designed to get your whole team on board, encouraging collective discussions and feedback loops.
Agile estimation is a team effort
In Agile, assumptions, uncertainties, and dependencies aren't shoved under the rug. They're put on the table for everyone to discuss. This open sharing serves a dual purpose.
First, it helps in coming up with an estimate grounded in collective knowledge. Second, it keeps stakeholders in the loop, adding a layer of transparency vital for long-term success.
Here are the three takeaways that'll improve your sprint velocity planning and project completion rates:
Collective Wisdom: Use your team’s diverse perspectives for a richer, more accurate estimation process. This includes everyone from developers to designers and even the testers.
Open Communication: Here, the secret sauce is sharing — assumptions, uncertainties, and dependencies, that is. Got a blocker you’re unsure of? Bring it up. Spotted a risk that could throw a wrench in the plan? Share it. It’s not just honest but also productive.
Trust & Transparency: Be upfront about your assumptions and uncertainties to build trust and alignment within the team and stakeholders.
Estimate smarter, not harder
It’s no secret that taking a few moments to reflect on your past estimates and comparing them with actual outcomes can be enlightening. You pinpoint where you were spot-on and, more importantly, where you missed the mark and why.
Keeping track of your metrics is also essential. However, not all metrics are created equal. Some are more telling than others. Here are the four key metrics to keep track of:
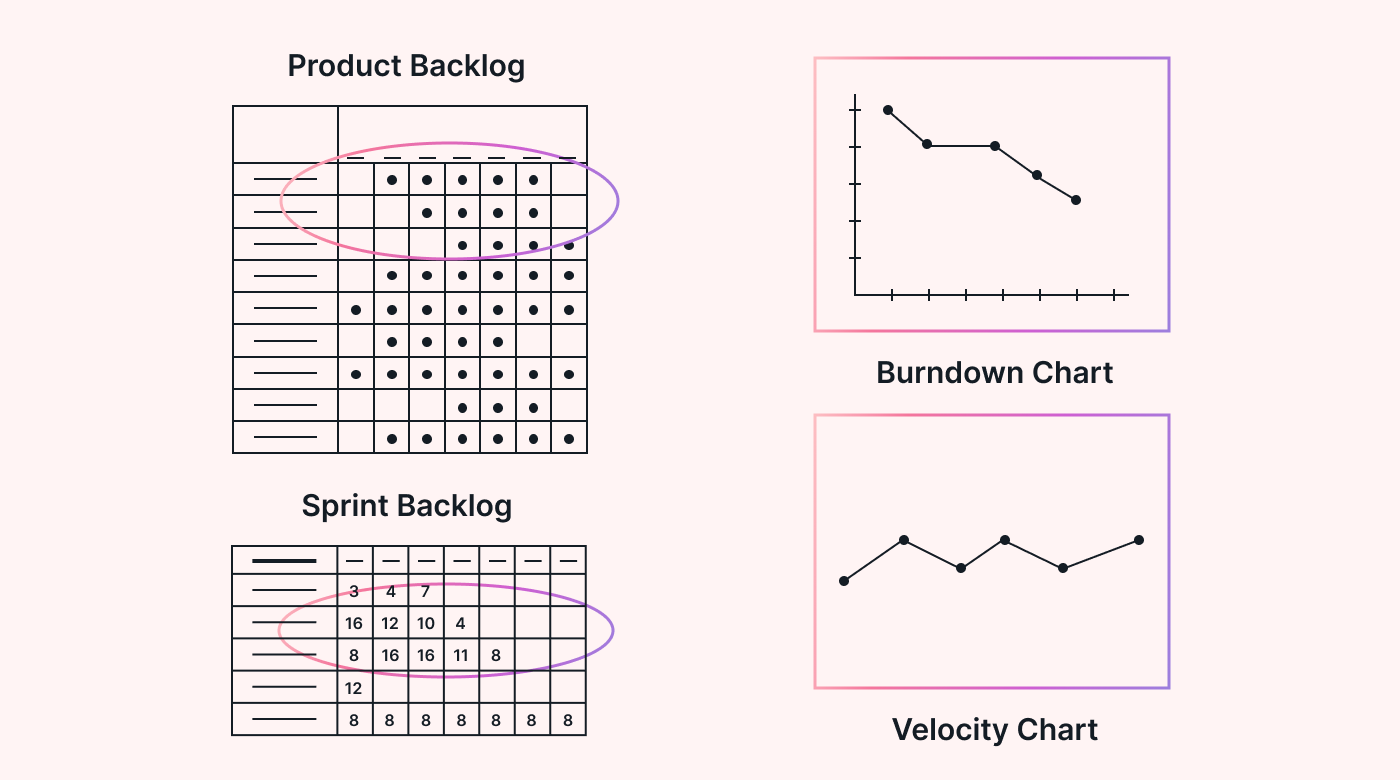
- Velocity: Measures how much work your team can complete in a sprint. For example, if your team completed 50 story points in the last sprint, that's your velocity.
- Burndown Charts: Track what's been done and what remains in a sprint. Imagine starting with 20 tasks and watching that number "burn down" to zero by the end of the sprint.
- Burnup Charts: This shows you the cumulative work done over time. So, if you’ve completed 2 out of 5 features, your burnup chart will show upward progress.
- Cumulative Flow Diagrams: These are colorful layered graphs that show the status of tasks in your product backlog — think tasks ’in progress,’ ‘completed,’ and ‘to-do.’ It’s like a snapshot of your team’s workflow at different stages.
You don't engage in this rigorous process merely for the sake of it. There are tangible benefits to reap. Calibration allows you to align your estimates more closely with actual outcomes, reducing errors and biases.
It also lets you fine-tune your story point values to reflect your team’s capacity and velocity better.
Lastly, you get to manage risks effectively, which helps you to identify and resolve any issues that could negatively impact your outcome.
4 steps to calculate your user story points
What you’ve been reading so far has been all theoretical, which is still vital in learning anything. But now, we go to the actionable stuff. In this section, we go over each part of creating a user story and give you a hypothetical example of each step.
Step 1: Determine your story point sequence
We've dissected this sequence in theory, so let's see it in action. For our imaginary team, the story point sequence will mirror the classic Agile methodology adaptation of Fibonacci: 0, 0.5, 1, 2, 3, 5, 8, 13, 20, 40, 100.
Some teams might find the Fibonacci too abstract, which brings us to t-shirt sizing. Tasks get sizes from XS to XXL, making it more intuitive to understand the scale of effort.
Hypothetical scenario part 1:
Our team is building a mobile app, and we’ve got tasks like implementing a login screen, creating a user dashboard, and incorporating a chat feature. Using our story point estimation sequence, the team decides the login screen is a 3. The user dashboard is 8, and the chat feature is 13.
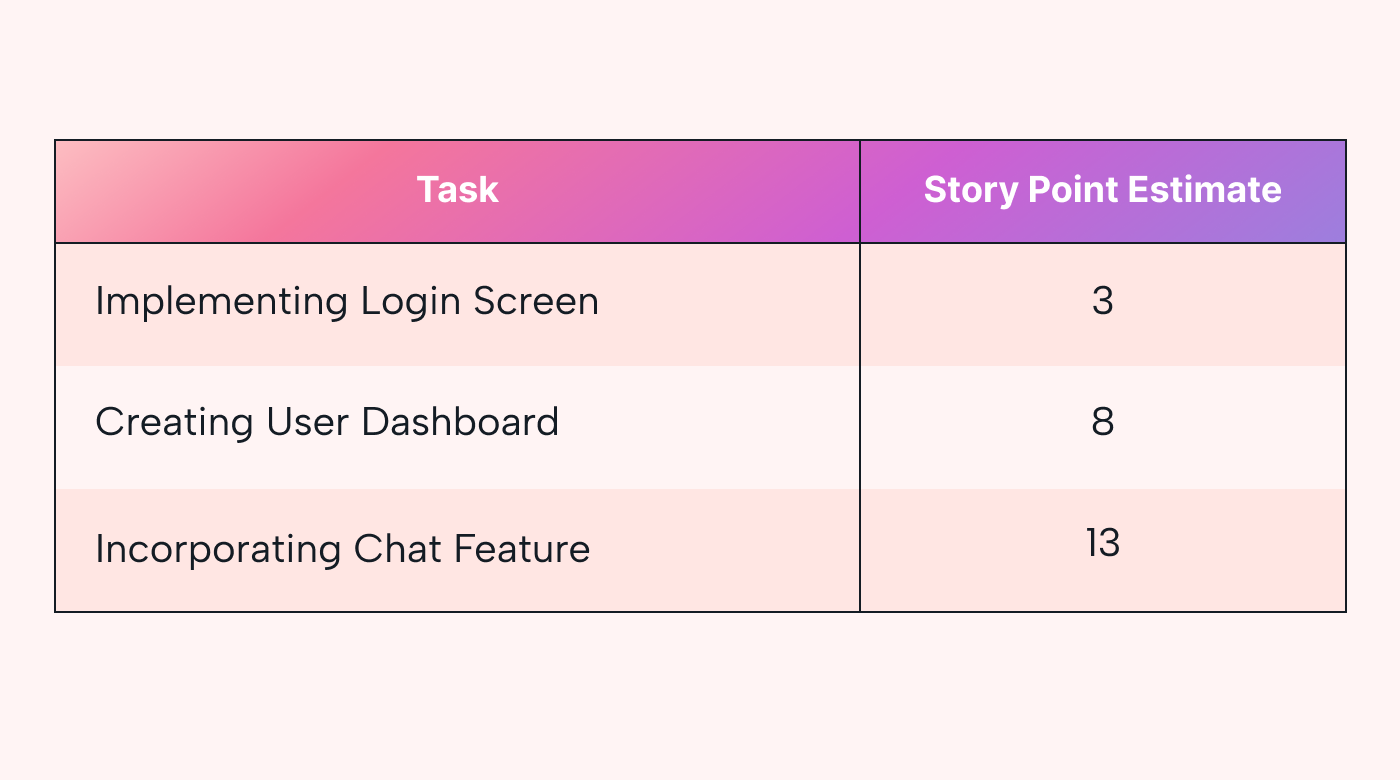 |
Pro tip: The numbers aren’t just random digits. They’re on a ratio scale. So, a task estimated at 8 points is considered twice as difficult as a 4-point task. No room for ambiguity here!
Step 2: Create a story point matrix
After determining your story point sequence, the next step is creating a matrix that maps each value in the story point sequence to a description or example of a user story.
This matrix serves as a guide to provide more context to the numbers and makes it easier to assign points to future user stories. Whenever story points are assigned, they can be easily placed in their respective rows, providing an at-a-glance view of the workload.
Hypothetical scenario part 2:
Continuing with our imaginary team building a mobile app, let's create a simple matrix to illustrate this.
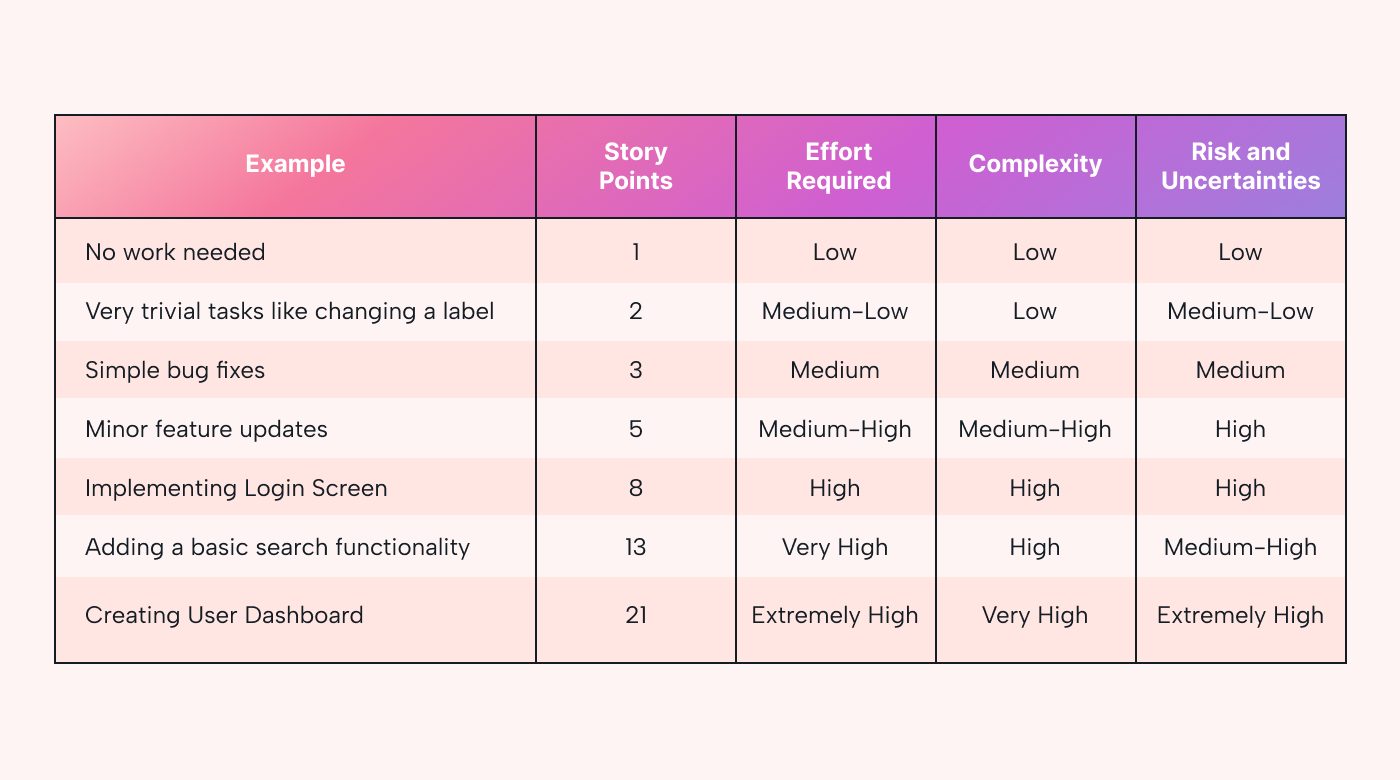 |
With this matrix, the team can quickly understand what each story point value represents, streamlining the estimation process. It also reduces ambiguity, making it easier to reach consensus during story point assignments.
Pro tip: The matrix isn't set in stone. It can evolve as the team gains more experience and better understands the intricacies of the project.
Step 3: Hold your poker meeting
So we’ve reached the fun step, planning poker. As discussed earlier, it’s a technique for assigning story points to user stories. Remember, the idea here is to get to a collective decision on the complexity of a user story, accounting for different viewpoints within the team.
Hypothetical scenario part 3:
Continuing with our imaginary mobile app development team from earlier, the team gathers for a planning poker session to estimate a new user story: implementing a payment gateway. Each team member has a card deck representing the adapted Fibonacci sequence (0, 0.5, 1, 2, 3, 5, 8, 13, 20, 40, 100).
Here’s how it usually goes:
- The product owner reads out the user story and clarifies any questions.
- Each team member privately selects a card from their deck. Let's say the selections are 8, 8, and 13.
- All cards are revealed simultaneously. Two members picked 8, and one picked 13.
- The member who picked 13 explains their reasoning, maybe citing potential complexities in integrating with various payment providers.
- After a brief discussion, the team agrees to revise the estimate to 13.
By the end of this Planning Poker session, the team has collaboratively assigned 13 story points to the 'Implementing Payment Gateway' user story.
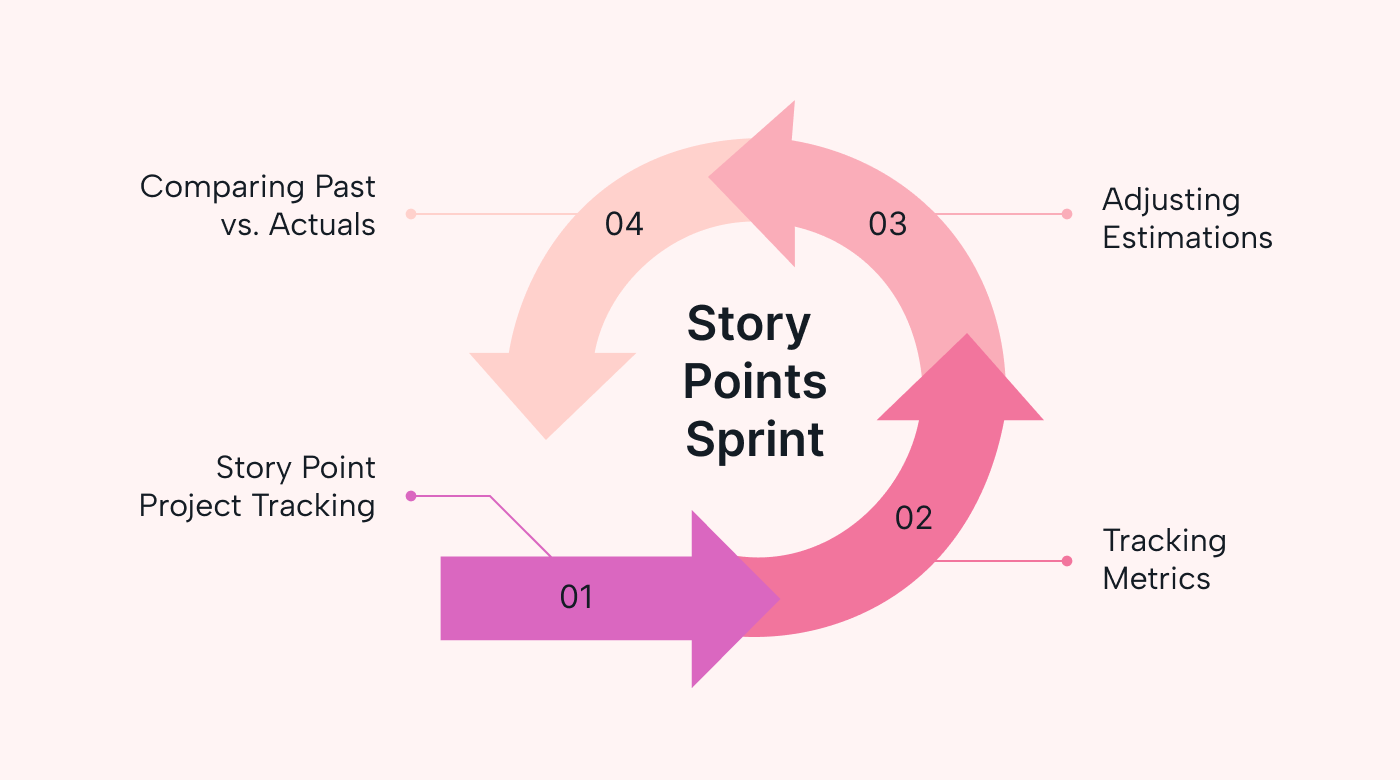
Step 4: Execute and improve your sprint
At this point, you've estimated your user stories and are ready to get to work. Execution is where the rubber meets the road, but it's more than just carrying out tasks. This step is also about continuous improvement, informed by real-world data and experience. Let's break it down:
- Utilize story point estimates: Start your sprint by using your story point estimates as guides for allocating resources and defining the sprint backlog.
- Monitor key metrics: Throughout the sprint, monitor metrics like velocity, burndown and burnup charts, and cumulative flow diagrams. These metrics show progress and can also be early indicators of issues.
- Iterative improvement: The sprint isn’t set in stone. As you go along, new updates and information may call for revisiting your story point values. This is good; it means you’re refining your estimates based on real-world experience.
- Review and adapt: At the end of each sprint, conduct a review to compare actual outcomes with your story point estimates. Identify gaps, learn from them, and apply these insights to future sprints.
 |
Hypothetical scenario part 4:
In our ongoing example of the mobile app development team, let’s say the team has kicked off a two-week sprint planning. They've committed to completing the login screen (3 points), user dashboard (8 points), and chat feature (13 points), totaling 24 story points.
Here’s how the next couple of weeks should pan out:
- Begin sprint: At the end of the first week, the team has completed the login screen and is halfway through the user dashboard. A quick look at the burndown chart shows they’re slightly behind schedule.
- Adjustment: Based on this, they decided to hold a quick meeting to discuss bottlenecks. One developer mentions some unforeseen complexities in the chat feature, indicating that the initial estimate of 13 might be low.
- Action: The team agrees to adjust the story point value for the chat feature to 21. They also decided to move one developer from the dashboard to the chat feature to help tackle the added complexity.
- Finish sprint: By the end of the sprint, they've completed all committed user stories. Their velocity for this sprint turns out to be 32 story points (3 for the login screen, 8 for the dashboard, and 21 for the chat).
- Review: In the retrospective, they discuss how mid-sprint adjustments were crucial for meeting their commitments. They decided to document these experiences to refine their future story point estimates.
This cycle of execution and adaptation provides the team with not just completed tasks but valuable insights, setting them up for even more effective sprints in the future.
How Motion can help you with project planning and story points
As discussed, user story points are a simple system. You assign story points, hold sprint meetings, prioritize, rinse, and repeat. It’s a system that works, but what if it could work better? This is where Motion comes into the picture.
Motion’s Intelligent Calendar and Task Manager combine your tasks, deadlines, and meetings into one automated, optimized schedule.
The AI warns you of looming deadlines and reshuffles priorities when the unexpected happens. Say goodbye to the endless to-do list and say hello to an AI-powered agenda that guarantees you're always on top of things.
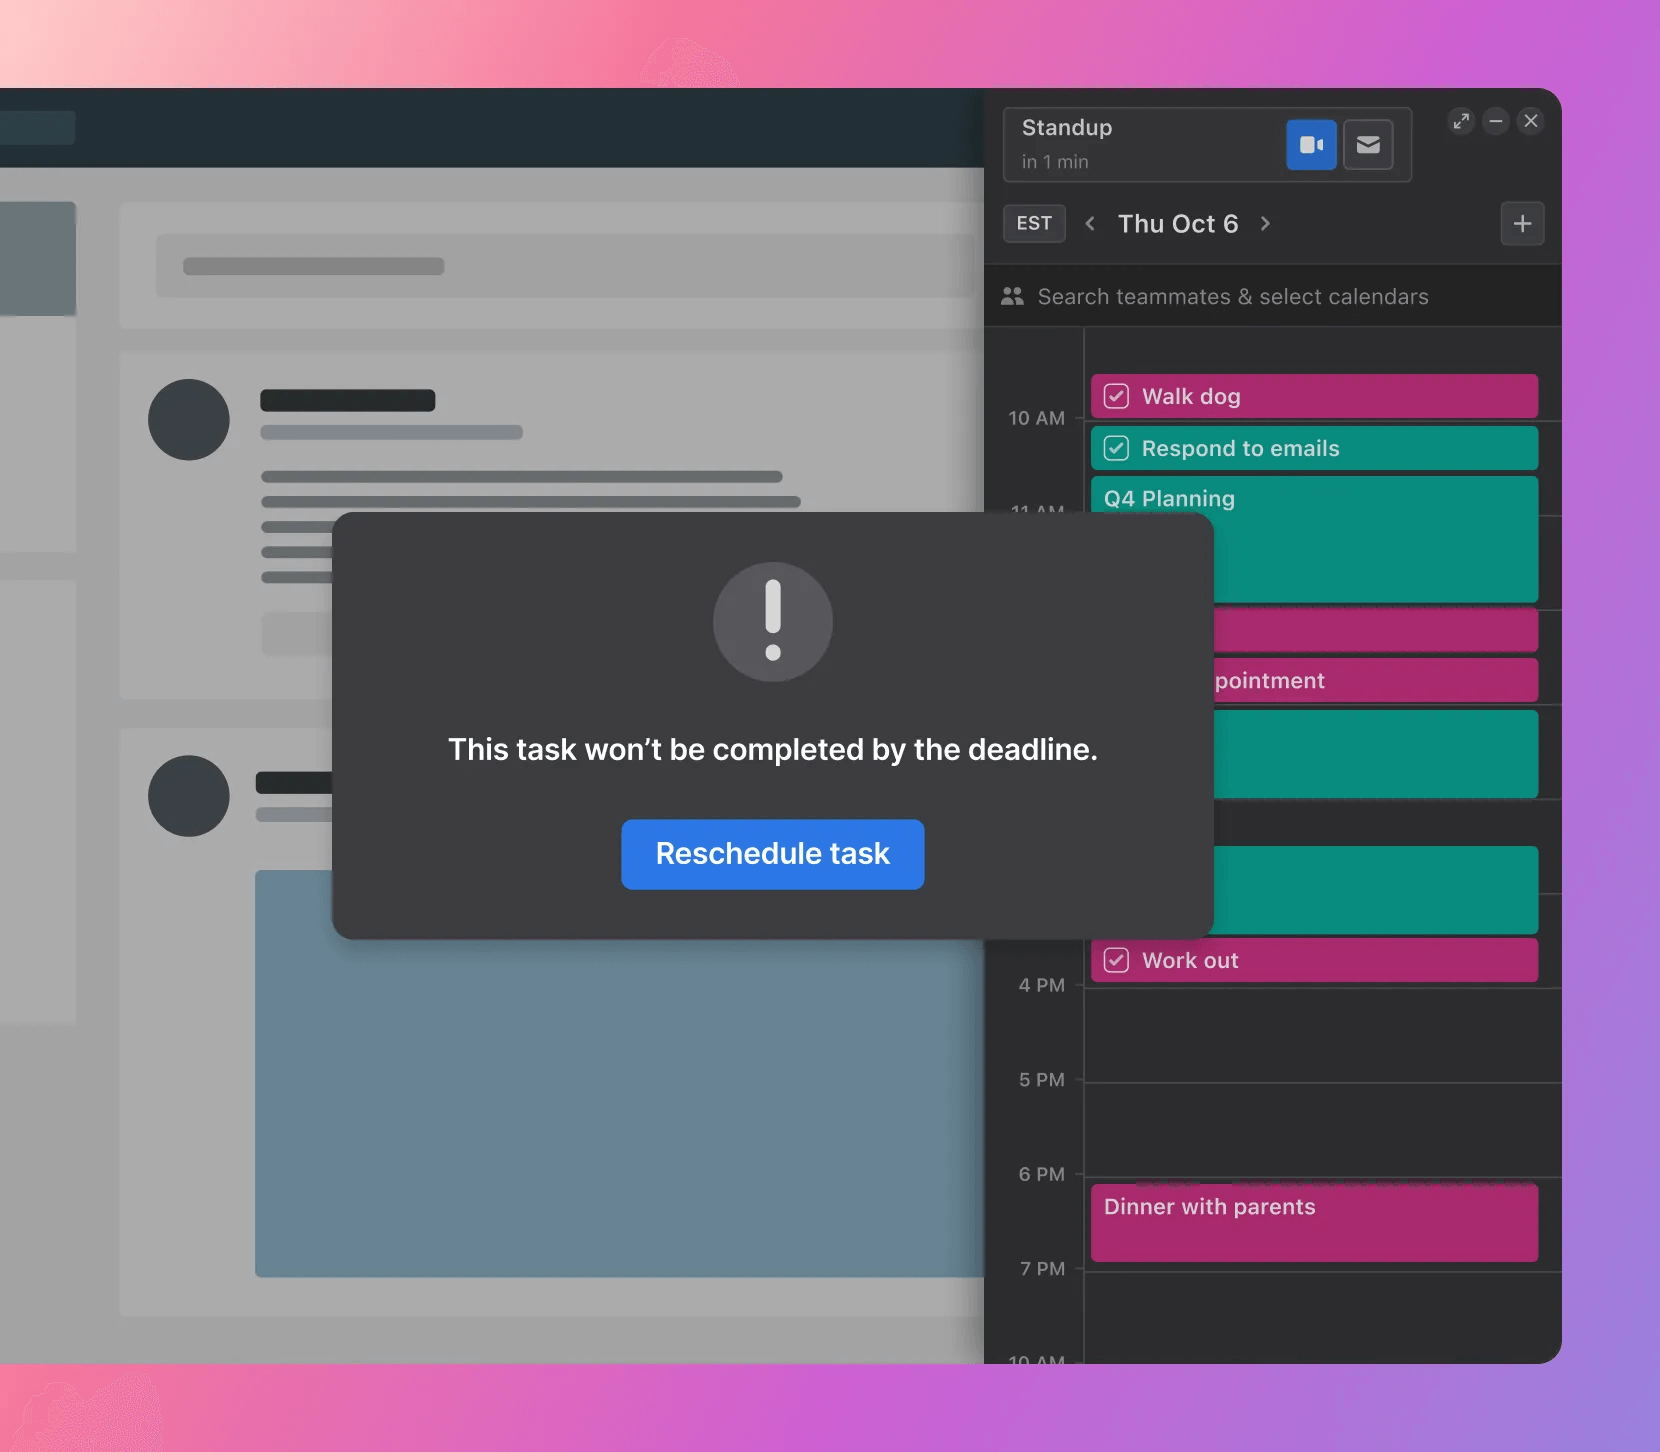 |
Story points and sprints are essential, but Motion supercharges their effectiveness. With seamless AI integration into every aspect of your work life, Motion isn't just a tool. It’s your next team member. So, are you ready to let AI take your productivity game to the next level?
To get started with Motion, sign up for a free trial today.


