While tracking productivity sounds straightforward, it can get messy.
The reality is it’s difficult to identify the most useful metrics and understand how to interpret them effectively without experience. In some roles, output isn’t even easy to put in numbers. And the endless options for tools and the overwhelming amount of data available can make things even murkier.
So to make your life easier, we put together this guide to productivity analytics. Read on to learn how to use them to help your team be more successful.
What is productivity analytics?
Productivity analytics is the practice of harnessing data to improve team efficiency and performance.
In other words, it’s looking at data to see how work is done and where it can be improved.
Think about an online retailer. They might analyze the time it takes to fulfill an order. Then, with these insights, they might streamline their packing processes or adjust their staff scheduling. The result is faster delivery and happier customers.
Productivity analytics is different from performance management. Performance management typically focuses on improving individual employee productivity. Productivity analytics, on the other hand, focuses on the processes and outputs of the entire team. That’s why it’s so impactful to the organization at large.
In short, productivity analytics are:
- Data-driven
- Based in strategy
- Actionable
8 useful productivity metrics
It’s important to remember that one size doesn’t fit all. Different industries — or even different departments within the same company — will have unique metrics.
Nevertheless, here are some metrics that are common to most operations:
- Revenue per employee: Measures the revenue each employee contributes. It’s used to learn about workforce efficiency.
- Employee satisfaction levels: Correlates employee motivation with productivity levels.
- Task completion rate: The percentage of completed tasks within a timeframe.
- Average handling time: Measures the efficiency of customer service by tracking resolution times.
- Utilization rate: Indicates the productive use of employees' available time.
- Projects completed: Tracks project completion to gauge team output and project management success.
- Overtime hours: Highlights overwork and discrepancies in scheduling.
- Turnover rate: Signals potential issues in job satisfaction, engagement, or culture.
It’s important to remember that productivity isn’t just about numbers. The human aspect of employee well-being must be accounted for in your strategy.
It’s all about finding that sweet spot where two things come together: operational efficiency and a healthy, motivated workforce. That balance leads to true productivity that can be sustained over the long haul.
Key tools for productivity analytics
This process of analyzing productivity involves many different tools. Let’s cover the main ones.
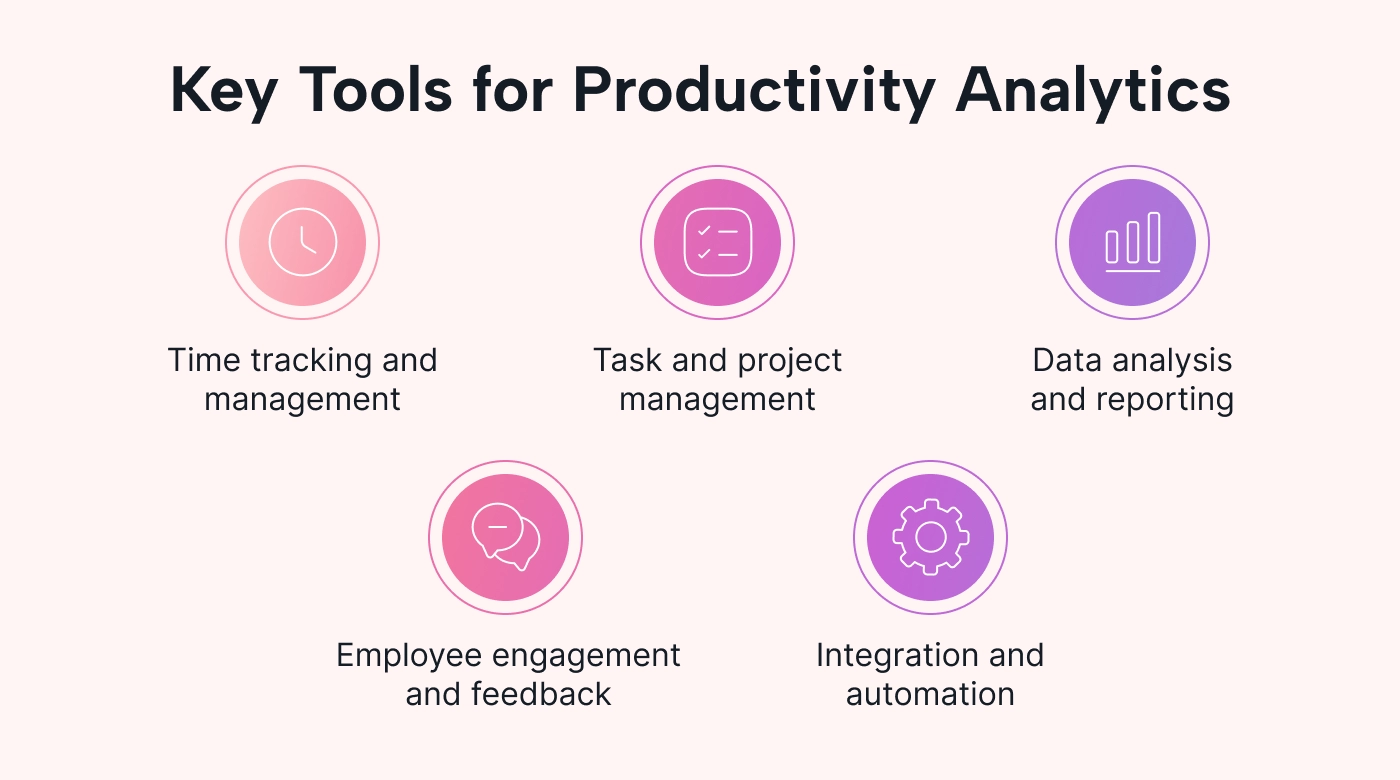 |
Time-tracking tools
Time-tracking tools shed light on how employees work and how much time projects take to complete.
Organizations can streamline their workflows by identifying tasks that use up excessive amounts of time.
For example: A design team might find specific bottlenecks through time tracking and use those insights to speed up their project turnaround times.
Task and project management software
Task and management software brings unique advantages, including features for collaboration, prioritizing tasks, and project tracking.
These tools are indispensable for keeping teams aligned and projects flowing.
For example: An event-planning company hosting multiple events could track progress on overlapping deadlines and milestones.
Data analysis and reporting platforms
Data analysis and reporting platforms offer advanced data visualization and analytics.
You can customize reporting features to specific needs and then directly apply those insights to your decision-making processes.
For example: A factory could track its machine performance in real time and set up better preventive maintenance.
Employee engagement tools
Employee engagement tools cover the essential human element of productivity. They help organizations understand and address the needs and concerns of their workforce through employee surveys, feedback collection, and analytics on engagement.
For example: A healthcare facility might gather feedback from employees that tells them they’d prefer more flexible hours. Enacting this change could improve job satisfaction, which will impact productivity.
Integration and automation solutions
Integration and automation solutions are a new frontier for enhancing productivity.
These tools automatically pull data from daily operations, integrate it across systems, and make the data available for understanding and improving productivity.
For example: An e-commerce business could use integration and automation solutions to maintain a real-time inventory and avoid the customer dissatisfaction that results from items being out of stock.
Implementing productivity analytics in your workflow
In this section, we share five steps for implementing productivity analytics. Each one is broken down into actionable tips you can get started with right away.
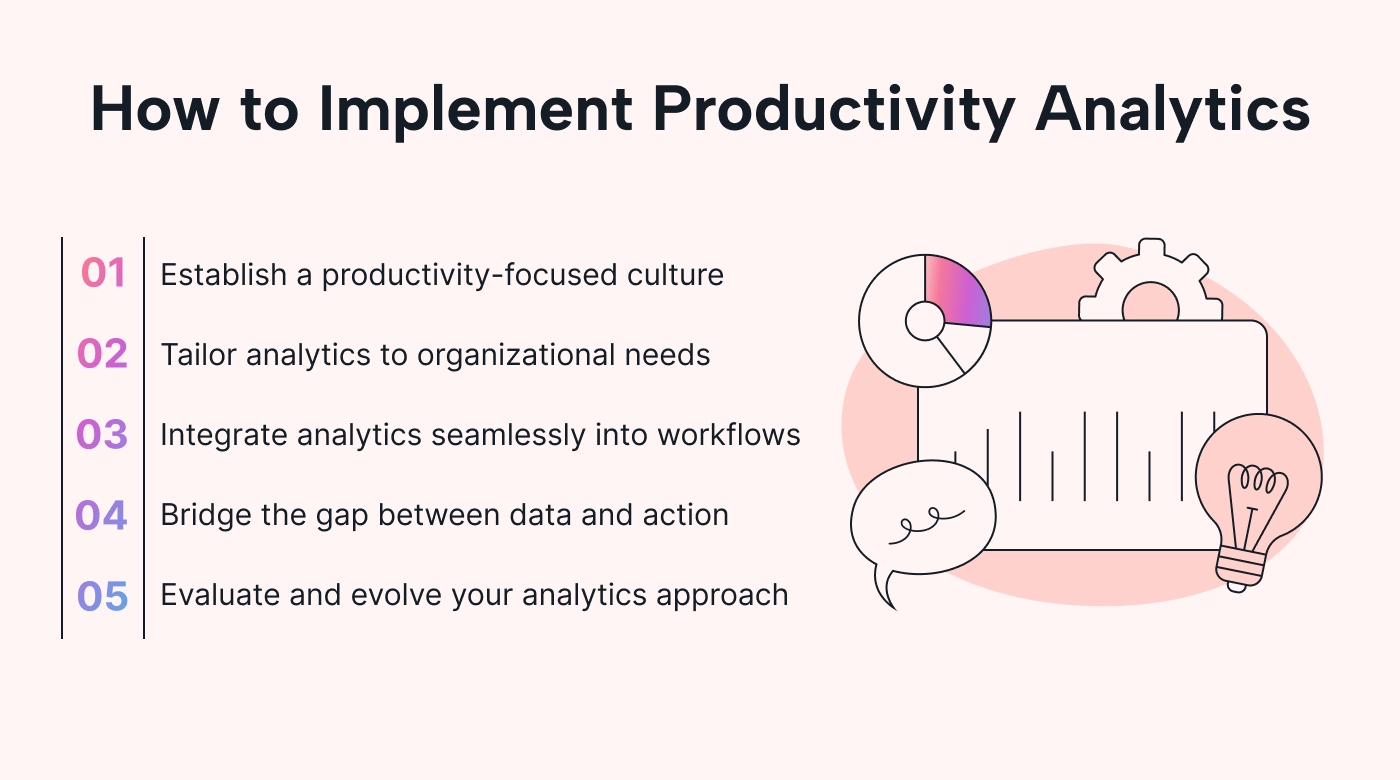 |
1. Establish a productivity-focused culture
For your productivity to stick, each team member should understand the value of data-driven decision-making.
Here’s how you can make that kind of culture a reality:
Promote transparency and understanding
Begin by making productivity analytics clear for all employees. Use workshops or seminars to explain how it works and its benefits. Host regular Q&A sessions where staff can ask questions and offer feedback on the data’s use.
Encourage team involvement
You want employees to feel a sense of ownership to boost their engagement and motivation. Involve each department in setting goals that are unique to them. You can also assign team ambassadors to be available to other staff.
Celebrate successes
Recognize and reward achievements that are based on data-driven insights. That can be in the form of acknowledgments during meetings, awards, or mentions in the company newsletter. Celebrating these victories highlights the value of analytics.
2. Tailor the analytics to your organizational needs
Data analytics must be relevant to your organization’s specific needs and goals.
Here’s how to create that alignment:
Step 1: Conduct a productivity audit
Start with a thorough assessment of your current practices and productivity levels. Identify areas of strength and those that require improvement. Look for bottlenecks, inefficiencies, and outdated technologies.
Step 2: Choose the relevant metrics
The metrics you choose should reflect your organization’s unique challenges and objectives. A manufacturer, for instance, might focus on machine uptime or output quality. On the other hand, a software development team might track sprint completion rates or bug resolution times.
Step 3: Align with strategy
Make sure the metrics you track are aligned with the broader business goals. For example, if you aim for customer satisfaction, prioritize metrics like net promoter score. Choose multiple metrics to give you a comprehensive view.
3. Integrate analytics seamlessly into workflows
Adopting productivity analytics means integrating them with existing processes. You don’t want your analytics tools to disrupt your business’s daily operations.
 |
Here are a few tips to make this integration as smooth as possible:
Automate data collection
Implement tools that automatically track and record productivity metrics. Even everyday apps, such as email or calendars, can be good sources of data. And with little effort, you can implement other systems to have data collection running in the background. AI-driven tools can sift through data and highlight trends and anomalies.
Choose user-friendly interfaces
Choose analytics platforms that have intuitive dashboards. Data should be presented in an accessible manner so that insights can be drawn from it. Many tools allow you to customize dashboards for different users.
Ensure integration
Make sure your data tools can be seamlessly incorporated into your existing tech stack. This might involve using application programming interfaces (APIs) or performing compatibility checks.
4. Bridge the gap between data and action
Collecting and analyzing data is just the beginning. The biggest hurdle is turning these insights into concrete actions.
Here are some tips to make data actionable:
Translate insights into strategy
Develop a structured process for reviewing analytics insights. Then, form strategies based on this data.
This task might involve regular strategy sessions. Or you could integrate analytics reviews into your decision-making processes. Either way, make sure you develop clear action plans with assigned parties, deadlines, and detailed steps.
Collaborate on improvement
Encourage departments to use data to improve team productivity together. Insights shared across teams can lead to better solutions to challenges.
Empower your team
Make the productivity metrics accessible to your team. Your team members will be more likely to come up with improvements or necessary solutions when they have clear information on productivity.
Role-based access controls can help team members see just the data that’s relevant to them, helping prevent them from getting overwhelmed. Data literacy programs for your staff can also help them act on data.
5. Evaluate and evolve your approach
Productivity analytics should be seen as part of an ongoing process of improvement. Use the data you collect to refine and adjust your strategies over time. Then, hold regular reviews and updates based on the latest data.
Here are some related tips:
Establish success metrics
Define specific, measurable goals for your initiatives. These could range from improved project completion times to reduced operational costs. Setting clear benchmarks helps you more accurately assess whether your efforts have been effective.
Embrace agility
Staying agile will prepare your organization for new tech advancements and industry trends that emerge. Small-scale pilot programs are a great way to test strategies and gain real-world feedback.
Foster continuous learning
As new tools and methodologies arise, keep your team informed and educated on them. You could sponsor attendance to webinars or online learning platforms, for example. That way, your team grows in step with new possibilities.
Common challenges in productivity analytics
You can’t focus on implementation without tackling the challenges that might pop up. Here are the most common hurdles when it comes to productivity analytics:
Privacy and trust issues
With as much digital oversight as there is today, concerns about privacy and surveillance are well-founded. This can be a significant barrier to adopting analytics approaches.
 |
To navigate this challenge, be transparent about data.
For instance, you should be open with your team about how data is:
- Collected
- Used
- Protected
Also, be sure to establish clear policies that safeguard employee data. And communicate these policies to your entire staff.
Building trust means demonstrating that analytics are used for mutual benefit. They are there to enhance workflows, not police employees.
Employee resistance
Resistance often stems from fear. Your team might be concerned that increased automation will make their jobs obsolete or that data will be used against them.
Education is the best way to offset these fears. Make sure your team knows the purpose and benefits of the methodologies you use. Focus on how your productivity analytics can make employees’ work more rewarding and less stressful.
The balance of data and intuition
Cold, hard numbers can’t capture the full scope of human work. They’ll certainly give you objective insights into the tools you’re using. But you also need to bring your own nuanced understanding — which comes from years of experience.
Make sure managers use data to complement their skills and judgment.
The human element in data
Just as human knowledge needs to be accounted for, employee well-being must be included in your analyses and strategies.
Consider factors such as:
- Morale
- Mental health
- Job satisfaction
Keeping these human variables in mind will help you make data decisions that don’t sacrifice well-being for productivity.
Surprising insights in productivity analytics
Before we wrap up, we want to give you a sense of the novel ways productivity analytics systems are being applied. Finally, we’ll take a glimpse at where we’re heading.
Beyond efficiency
Productivity analytics aren’t just for increasing output. The same approach can be applied to employee satisfaction and engagement.
For example: By analyzing work patterns, organizations can identify stress points and areas for improvement. They can then use these insights to create a more supportive workplace.
Innovative uses of data
Companies can find creative ways to leverage productivity data.
 |
They can use it to improve their sustainability, for instance. For example, a manufacturer could reduce the energy or resources they use based on the data they gather.
Other companies use these processes to personalize customer interactions. They can analyze the data on different customer service approaches, for instance. Then, they can tailor their strategy to match customer preferences.
The future of productivity analytics
As we’ve mentioned, the productivity analytics field is still emerging. With the acceleration of AI and machine learning, new horizons are a given.
Predictive analytics continues to improve. That’s where tools foresee potential bottlenecks and make proactive recommendations based on those issues.
The integration of biometric data, which offers insights into staff’s physical and emotional well-being, is another trend that will continue.
Lastly, a shift toward more holistic, employee-centered approaches will add nuances to organizations’ strategies in this domain.
Get data-driven productivity with Motion
We hope you’re now ready to take on the world with modern data solutions. Productivity analytics is more art than science, so be patient as you implement these strategies.
As you think about choosing the best tools, Motion is purpose-built to supercharge your team’s productivity. From optimizing schedules to helping your team stay focused, we can help you free up two hours every day.
Try Motion for free today!

Jared Posey is a business, SaaS, and productivity freelance writer with a passion for conencting readers with high-quality content. When he's not polishing up a sentence or conducting SERP research, you'll find him making his kids laugh and his wife shake her head.


